TA: Bitcoin Consolidates Near Key Juncture, Can The Bulls Make It
Bitcoin is struggling near the $21,000 resistance zone against the US Dollar. BTC could rally if it clears the $20,900 and $21,000 resistance levels.
Bitcoin is showing a few positive signs above the $20,000 support.
The price is now still above the $20,000 level and the 100 hourly simple moving average.
There is a connecting bullish trend line forming with support near $20,275 on the hourly chart of the BTC/USD pair (data feed from Kraken).
The pair could start a fresh decline if it stays below the key $21,000 resistance zone.
Bitcoin Price Eyes Upside Break
Bitcoin price started an upside correction after it traded as low as $17,600. There was a decent recovery wave above the $18,500 and $19,000 levels.
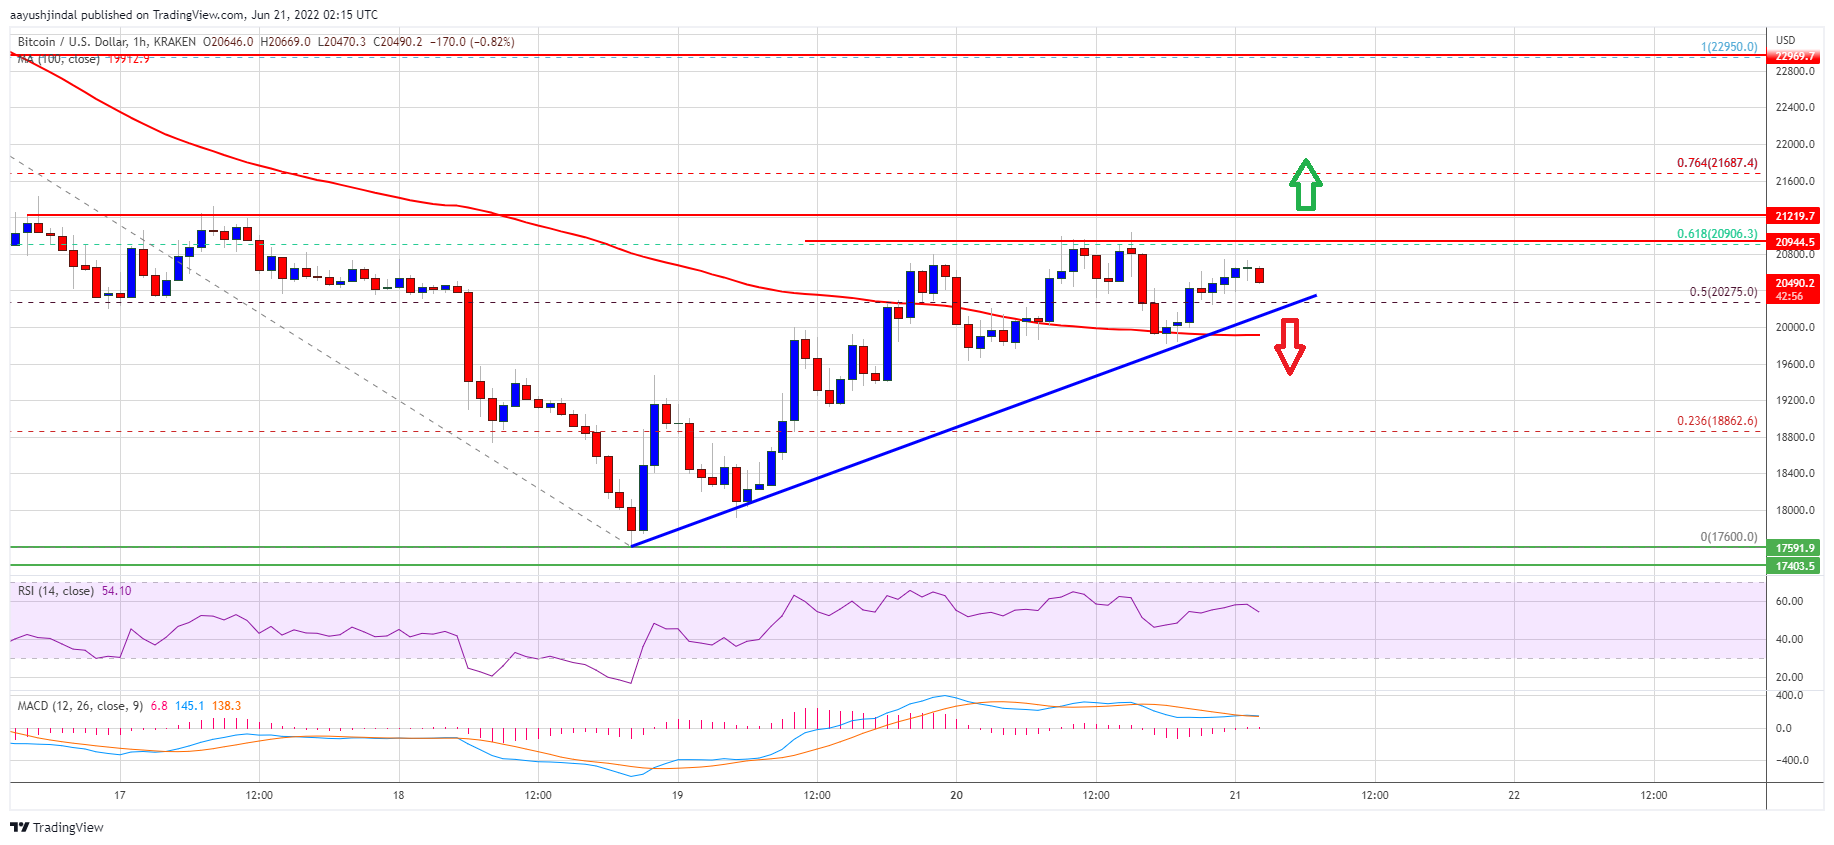
The price surpassed the 50% Fib retracement level of the main drop from the $22,951 high to $17,600 low. The price even cleared the $20,000 level and the 100 hourly simple moving average. There is also a connecting bullish trend line forming with support near $20,275 on the hourly chart of the BTC/USD pair.
However, the bears are now defending major gains above the $20,500 zone. Bitcoin is also struggling near the 61.8% Fib retracement level of the main drop from the $22,951 high to $17,600 low. An immediate resistance on the upside is near the $20,800 level. The first major resistance is near the $20,900 and $21,000 levels.
Source: BTCUSD on TradingView.com
A clear move above the $21,000 level could even push the price towards $21,800. Any more gains might send the price towards the $22,200 level in the coming sessions.
Fresh Decline in BTC?
If bitcoin fails to clear the $21,000 resistance zone, it could start a fresh decline. An immediate support on the downside is near the $20,275 level and the trend line.
The next major support is near the $20,000 level and the 100 hourly SMA. A downside break below the $20,000 support could spark another decline. In the stated case, the price could test $18,800.
Technical indicators:
Hourly MACD – The MACD is now losing pace in the bullish zone.
Hourly RSI (Relative Strength Index) – The RSI for BTC/USD is now above the 50 level.
Major Support Levels – $20,275, followed by $20,000.
Major Resistance Levels – $20,900, $21,000 and $22,000.
Bitcoin is struggling near the $21,000 resistance zone against the US Dollar. BTC could rally if it clears the $20,900 and $21,000 resistance levels.
Bitcoin is showing a few positive signs above the $20,000 support.
The price is now still above the $20,000 level and the 100 hourly simple moving average.
There is a connecting bullish trend line forming with support near $20,275 on the hourly chart of the BTC/USD pair (data feed from Kraken).
The pair could start a fresh decline if it stays below the key $21,000 resistance zone.
Bitcoin Price Eyes Upside Break
Bitcoin price started an upside correction after it traded as low as $17,600. There was a decent recovery wave above the $18,500 and $19,000 levels.
The price surpassed the 50% Fib retracement level of the main drop from the $22,951 high to $17,600 low. The price even cleared the $20,000 level and the 100 hourly simple moving average. There is also a connecting bullish trend line forming with support near $20,275 on the hourly chart of the BTC/USD pair.
However, the bears are now defending major gains above the $20,500 zone. Bitcoin is also struggling near the 61.8% Fib retracement level of the main drop from the $22,951 high to $17,600 low. An immediate resistance on the upside is near the $20,800 level. The first major resistance is near the $20,900 and $21,000 levels.
Source: BTCUSD on TradingView.com
A clear move above the $21,000 level could even push the price towards $21,800. Any more gains might send the price towards the $22,200 level in the coming sessions.
Fresh Decline in BTC?
If bitcoin fails to clear the $21,000 resistance zone, it could start a fresh decline. An immediate support on the downside is near the $20,275 level and the trend line.
The next major support is near the $20,000 level and the 100 hourly SMA. A downside break below the $20,000 support could spark another decline. In the stated case, the price could test $18,800.
Technical indicators:
Hourly MACD – The MACD is now losing pace in the bullish zone.
Hourly RSI (Relative Strength Index) – The RSI for BTC/USD is now above the 50 level.
Major Support Levels – $20,275, followed by $20,000.
Major Resistance Levels – $20,900, $21,000 and $22,000.
Tags: bitcoinbtcusdBTCUSDTxbtusd
FeedzyRead More


Recent Posts
Bitcoin Sees Selling at $97K, Cardano’s ADA Leads Majors Gains Ahead of FOMC Meeting
Bitcoin surged above $97,000 late Tuesday, then slid to $96,500 in Asian hours Wednesday as…
Forecasting Fed-Induced Price Swings in Bitcoin, Ether, Solana and XRP
It's the Fed day again, and traders are seeking cues on how much volatility this…
Bitcoin Price Bounces Back After Dip—Traders Eye Next Resistance Zone
Bitcoin price started a downside correction and tested the $94,000 zone. BTC is again rising…
Bitcoin Price Forecast: Key Scenarios For Tomorrow’s FOMC Decision
With the Federal Open Market Committee set to announce its May 7 policy decision, Bitcoin…
Bitcoin Races Above $97K on U.S./China Trade Deal Progress
A thawing in the trade stance from both the U.S. and China has sent risk…
Bitcoin Mining Giant Abandons Full-Hold Strategy, Unloads $40M In Crypto
Riot Platforms sold 475 Bitcoin worth $38.8 million in December as profit margins narrow throughout…