Bitcoin struggled to clear the $42,500 resistance against the US Dollar. BTC is correcting gains and might find bids near the $40,000 support zone.
Bitcoin started a downside correction from the $42,500 resistance zone.
The price is trading below $41,500 and the 100 hourly simple moving average.
There was a break below a key bullish trend line with support near $41,550 on the hourly chart of the BTC/USD pair (data feed from Kraken).
The pair might start a fresh increase unless there is a clear move below the $40,000 support zone.
Bitcoin Price Dips Below Support
Bitcoin price made two attempts to clear the $42,500 resistance zone. BTC formed a high near the $42,400 zone and started a downside correction.
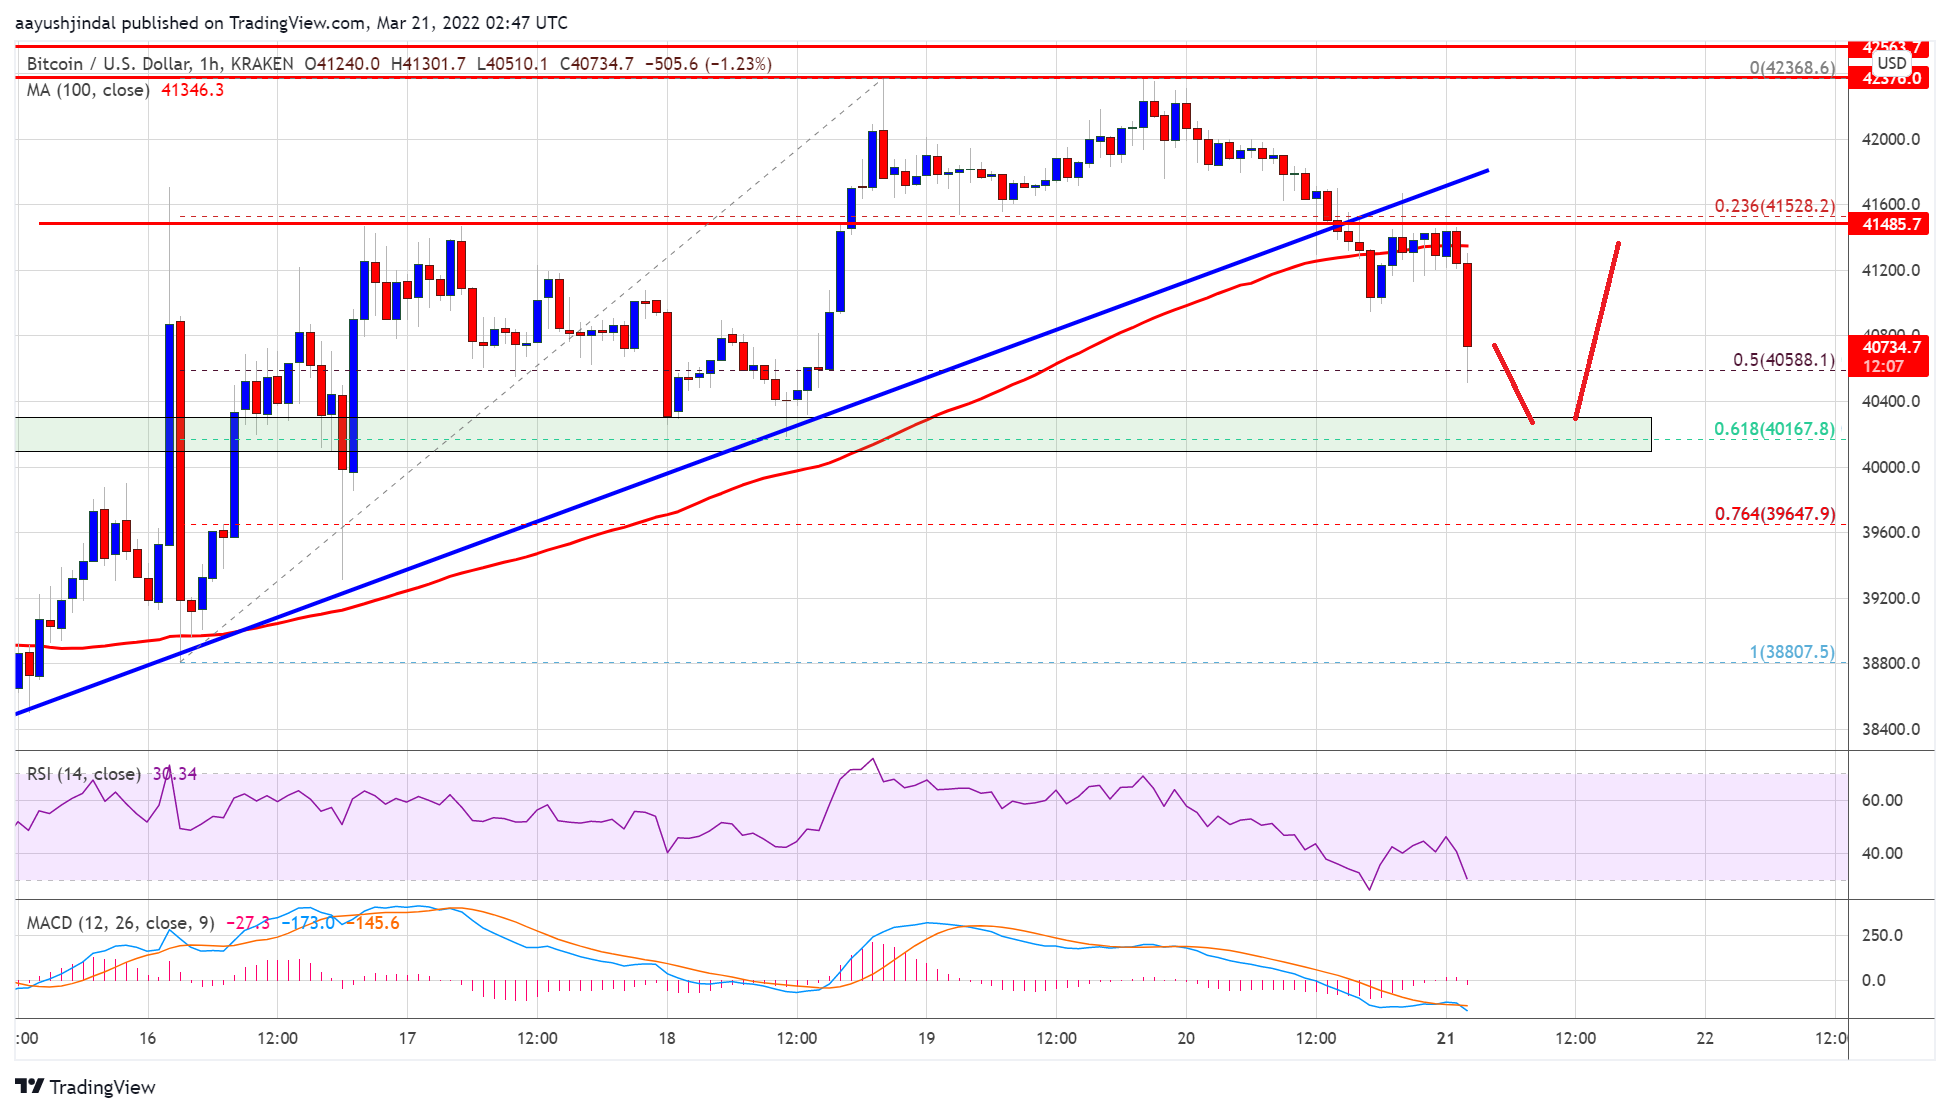
The price declined below the $42,000 and $41,500 support levels. It even traded below $41,200 and the 100 hourly simple moving average. Besides, there was a break below a key bullish trend line with support near $41,550 on the hourly chart of the BTC/USD pair.
The pair is now testing the 50% Fib retracement level of the upward move from the $38,810 swing low to $42,370 high. On the upside, the price is facing resistance near the $41,000 level.
Source: BTCUSD on TradingView.com
The next major resistance could be near the $41,200 zone and the 100 hourly SMA. A successful break and close above the $41,200 level might start a steady increase. In the stated case, the price might rise towards the $42,000 level. Any more gains might send the price towards the key $42,500 barrier in the near term.
Downside Break in BTC?
If bitcoin fails to clear the $41,200 resistance zone, it could continue to move down. An immediate support on the downside is near the $40,500 zone.
The next major support is seen near the $40,000 level. It is near the 61.8% Fib retracement level of the upward move from the $38,810 swing low to $42,370 high. A downside break below the $40,000 support zone could start a sharp decline. In this case, the price may perhaps decline towards the $38,500 level.
Technical indicators:
Hourly MACD – The MACD is now gaining pace in the bearish zone.
Hourly RSI (Relative Strength Index) – The RSI for BTC/USD is now below the 50 level.
Major Support Levels – $40,500, followed by $40,000.
Major Resistance Levels – $41,200, $41,500 and $42,500.
Bitcoin struggled to clear the $42,500 resistance against the US Dollar. BTC is correcting gains and might find bids near the $40,000 support zone.
Bitcoin started a downside correction from the $42,500 resistance zone.
The price is trading below $41,500 and the 100 hourly simple moving average.
There was a break below a key bullish trend line with support near $41,550 on the hourly chart of the BTC/USD pair (data feed from Kraken).
The pair might start a fresh increase unless there is a clear move below the $40,000 support zone.
Bitcoin price made two attempts to clear the $42,500 resistance zone. BTC formed a high near the $42,400 zone and started a downside correction.
The price declined below the $42,000 and $41,500 support levels. It even traded below $41,200 and the 100 hourly simple moving average. Besides, there was a break below a key bullish trend line with support near $41,550 on the hourly chart of the BTC/USD pair.
The pair is now testing the 50% Fib retracement level of the upward move from the $38,810 swing low to $42,370 high. On the upside, the price is facing resistance near the $41,000 level.
Source: BTCUSD on TradingView.com
The next major resistance could be near the $41,200 zone and the 100 hourly SMA. A successful break and close above the $41,200 level might start a steady increase. In the stated case, the price might rise towards the $42,000 level. Any more gains might send the price towards the key $42,500 barrier in the near term.
If bitcoin fails to clear the $41,200 resistance zone, it could continue to move down. An immediate support on the downside is near the $40,500 zone.
The next major support is seen near the $40,000 level. It is near the 61.8% Fib retracement level of the upward move from the $38,810 swing low to $42,370 high. A downside break below the $40,000 support zone could start a sharp decline. In this case, the price may perhaps decline towards the $38,500 level.
Technical indicators:
Hourly MACD – The MACD is now gaining pace in the bearish zone.
Hourly RSI (Relative Strength Index) – The RSI for BTC/USD is now below the 50 level.
Major Support Levels – $40,500, followed by $40,000.
Major Resistance Levels – $41,200, $41,500 and $42,500.
Tags: bitcoinbtcusdBTCUSDTxbtusd
FeedzyRead More
A sluggish Bitcoin price performance has not been the only disappointing theme for the largest…
World Liberty Financial, Trump’s crypto company, is making moves again. It recently bought another $1.4M…
Disclaimer: The analyst who wrote this piece owns shares of Strategy (MSTR) Strategy (MSTR) could…
Peter Brandt, a seasoned trader, has dismissed optimistic predictions in the wake of Bitcoin’s recent…
This article is part of a four-piece series on El Salvador. You can find the…
It was another volatile trading week in the Bitcoin (BTC) market marked by almost equal…