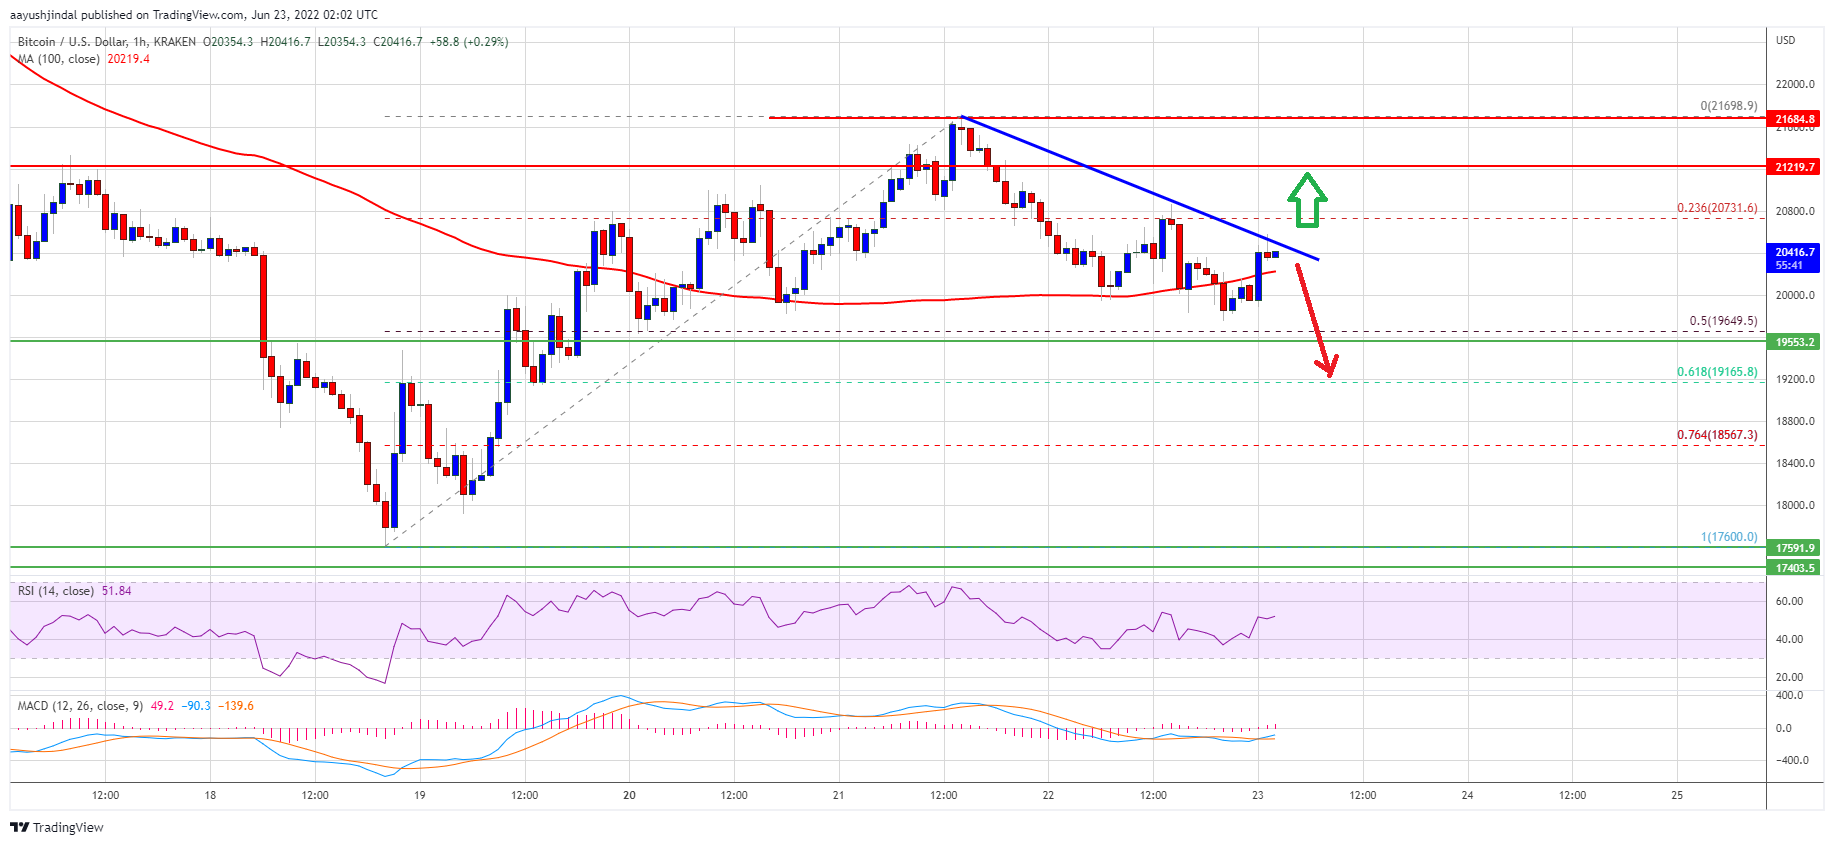
Bitcoin is consolidating above the $20,000 zone against the US Dollar. BTC must clear the $20,800 resistance to restart increase in the near term.
Bitcoin corrected gains and tested the $19,800 support zone.
The price is now above the $20,000 level and the 100 hourly simple moving average.
There is a key bearish trend line forming with resistance near $20,550 on the hourly chart of the BTC/USD pair (data feed from Kraken).
The pair could gain bullish momentum if it clears the $20,550 and $20,800 resistance levels.
Bitcoin Price Faces Resistance
Bitcoin price failed to gain pace above $21,700 and corrected gains. There was a downside correction below the $21,000 support zone.
The price declined below the 23.6% Fib retracement level of the upward move from the $17,600 swing low to $21,700 swing high. The bears even pushed the price below the $20,500 support zone and the 100 hourly simple moving average.
However, the bulls were active above the $19,650 and $19,800 support levels. Bitcoin also stayed above the 50% Fib retracement level of the upward move from the $17,600 swing low to $21,700 swing high.
It is now above the $20,000 level and the 100 hourly simple moving average. An immediate resistance on the upside is near the $20,550 level. There is also a key bearish trend line forming with resistance near $20,550 on the hourly chart of the BTC/USD pair.
Source: BTCUSD on TradingView.com
The first major resistance is near the $20,800 level. A clear move above the $20,800 level might start a decent increase. The next major resistance sits near the $21,220 level, above which the bulls might gain strength for a steady increase.
More Losses in BTC?
If bitcoin fails to clear the $20,800 resistance zone, it could start another decline. An immediate support on the downside is near the $20,200 level and the 100 hourly SMA.
The first major support is near the $20,000 level. The main support is now near the $19,650 level. A downside break below the $19,650 support could restart decline in the near term. In the stated case, the price might slide towards the $18,800 level.
Technical indicators:
Hourly MACD – The MACD is now gaining pace in the bullish zone.
Hourly RSI (Relative Strength Index) – The RSI for BTC/USD is now above the 50 level.
Major Support Levels – $20,000, followed by $19,650.
Major Resistance Levels – $20,800, $21,220 and $21,700.
Bitcoin is consolidating above the $20,000 zone against the US Dollar. BTC must clear the $20,800 resistance to restart increase in the near term.
Bitcoin corrected gains and tested the $19,800 support zone.
The price is now above the $20,000 level and the 100 hourly simple moving average.
There is a key bearish trend line forming with resistance near $20,550 on the hourly chart of the BTC/USD pair (data feed from Kraken).
The pair could gain bullish momentum if it clears the $20,550 and $20,800 resistance levels.
Bitcoin price failed to gain pace above $21,700 and corrected gains. There was a downside correction below the $21,000 support zone.
The price declined below the 23.6% Fib retracement level of the upward move from the $17,600 swing low to $21,700 swing high. The bears even pushed the price below the $20,500 support zone and the 100 hourly simple moving average.
However, the bulls were active above the $19,650 and $19,800 support levels. Bitcoin also stayed above the 50% Fib retracement level of the upward move from the $17,600 swing low to $21,700 swing high.
It is now above the $20,000 level and the 100 hourly simple moving average. An immediate resistance on the upside is near the $20,550 level. There is also a key bearish trend line forming with resistance near $20,550 on the hourly chart of the BTC/USD pair.
Source: BTCUSD on TradingView.com
The first major resistance is near the $20,800 level. A clear move above the $20,800 level might start a decent increase. The next major resistance sits near the $21,220 level, above which the bulls might gain strength for a steady increase.
If bitcoin fails to clear the $20,800 resistance zone, it could start another decline. An immediate support on the downside is near the $20,200 level and the 100 hourly SMA.
The first major support is near the $20,000 level. The main support is now near the $19,650 level. A downside break below the $19,650 support could restart decline in the near term. In the stated case, the price might slide towards the $18,800 level.
Technical indicators:
Hourly MACD – The MACD is now gaining pace in the bullish zone.
Hourly RSI (Relative Strength Index) – The RSI for BTC/USD is now above the 50 level.
Major Support Levels – $20,000, followed by $19,650.
Major Resistance Levels – $20,800, $21,220 and $21,700.
Tags: bitcoinbtcusdBTCUSDTxbtusd
FeedzyRead More
By launching its Macro Strategic Reserve, World Liberty Financial (WLFI) has advanced significantly and strengthened…
Bitcoin (BTC) continues to move within its one-week range after recovering from its recent drop…
Alexander Vinnik, the jailed former operator of once mighty bitcoin exchange BTC-e, is being released…
Founder: Nicolas Burtey Date Founded: September 2019 Location of Headquarters: United States Number of Employees:…
Bitcoin Twitter (or Bitcoin X) is having a moment after a 13F filing by Goldman…
After a relatively subdued price performance in 2024, Ethereum (ETH) could be on the verge…