TA: Bitcoin Dives Below $40K, Why BTC Could Recover In Short-Term
Bitcoin gained bearish momentum and even declined below $40,000 against the US Dollar. BTC could recover if it manages to climb above the $40,000 pivot level.
Bitcoin remained in a bearish zone and extended decline below $40,000.
The price is now trading below $40,000 and the 100 hourly simple moving average.
There is a steep bearish trend line forming with resistance near $39,700 on the hourly chart of the BTC/USD pair (data feed from Kraken).
The pair could start a short-term recovery if there is a move above $40,000.
Bitcoin Price Gains Bearish Pace
Bitcoin price struggled to recover above the $43,500 level. BTC started another decline and traded below the $42,000 support level.
The bears took control and pushed the price below the $41,000 level. There was also a clear move below the $40,000 support zone and a close below the 100 hourly simple moving average. The price traded as low as $39,240 and is currently consolidating losses.
An immediate resistance on the upside is near the $39,700 level. There is also a steep bearish trend line forming with resistance near $39,700 on the hourly chart of the BTC/USD pair.
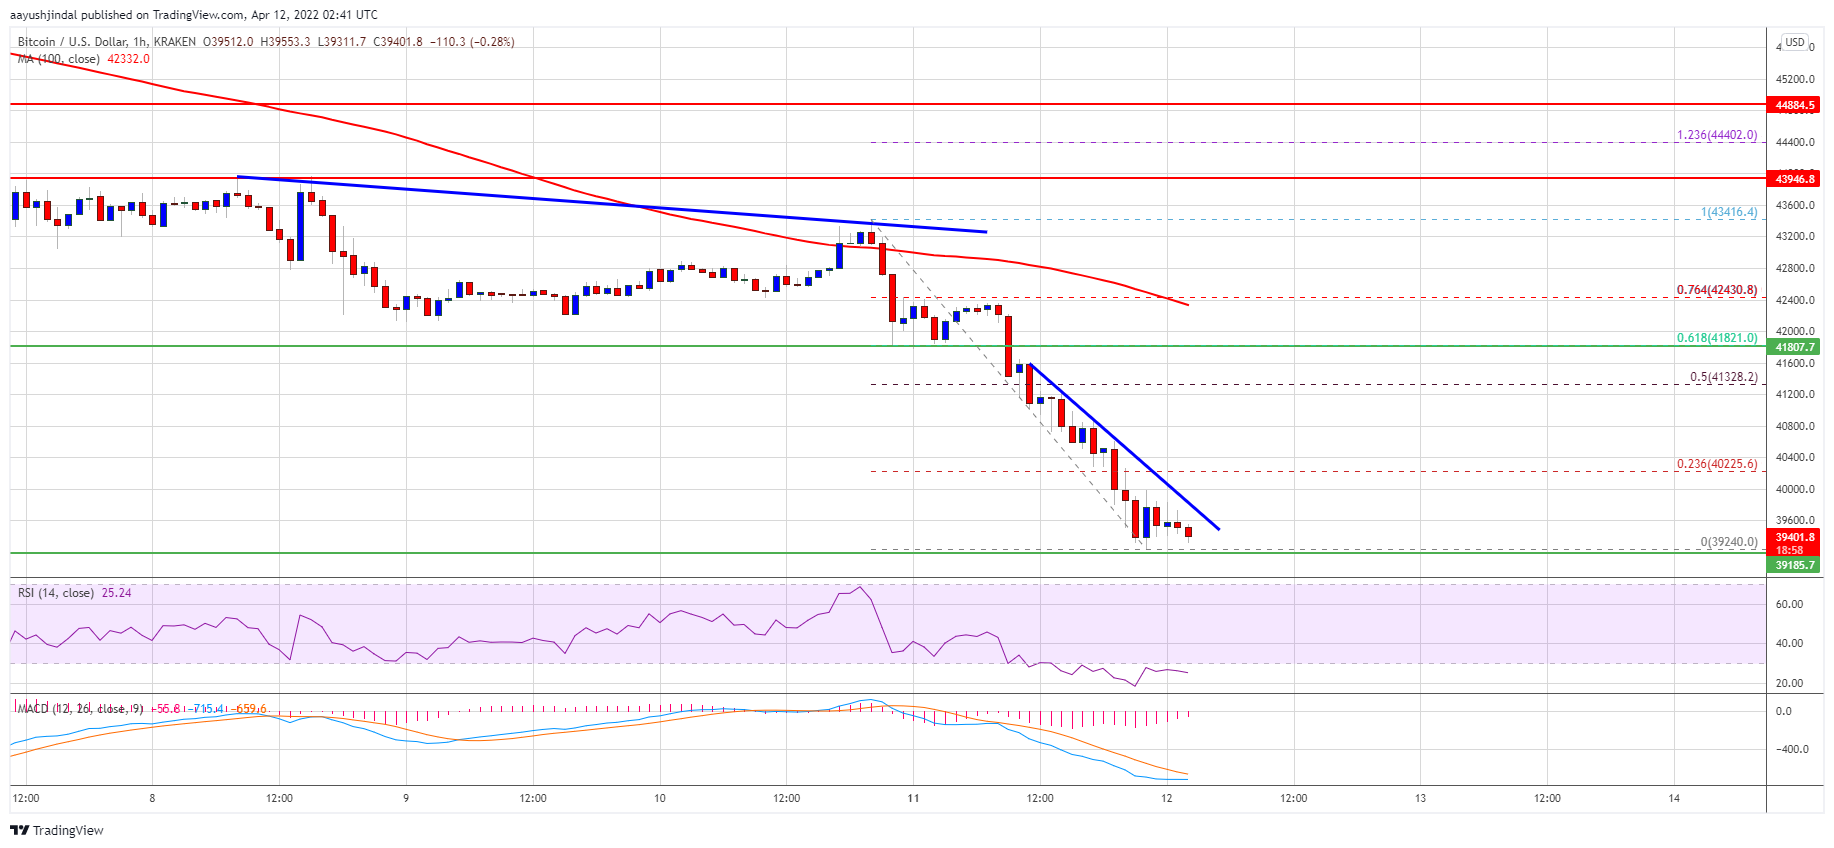
The first major resistance is forming near the $40,000 level. The next resistance could be near $40,200. It is close to the 23.6% Fib retracement level of the recent decline from the $43,415 swing high from the $39,240 low. A clear move above the $40,000 and $40,200 levels might start a short-term recovery wave.
Source: BTCUSD on TradingView.com
In the stated case, the price may perhaps rise towards the $41,350 resistance zone. It is near the 50% Fib retracement level of the recent decline from the $43,415 swing high from the $39,240 low.
More Losses in BTC?
If bitcoin fails to clear the $40,000 resistance zone, it could continue to move down. An immediate support on the downside is near the $39,250 level.
The next major support is seen near the $38,880 level. A downside break below the $38,880 support zone could increase selling pressure. In the stated case, the price could accelerate lower towards the $37,500 level in the coming sessions.
Technical indicators:
Hourly MACD – The MACD is now gaining pace in the bearish zone.
Hourly RSI (Relative Strength Index) – The RSI for BTC/USD is now in the oversold zone.
Major Support Levels – $39,250, followed by $38,880.
Major Resistance Levels – $39,700, $40,000 and $40,200.
Bitcoin gained bearish momentum and even declined below $40,000 against the US Dollar. BTC could recover if it manages to climb above the $40,000 pivot level.
Bitcoin remained in a bearish zone and extended decline below $40,000.
The price is now trading below $40,000 and the 100 hourly simple moving average.
There is a steep bearish trend line forming with resistance near $39,700 on the hourly chart of the BTC/USD pair (data feed from Kraken).
The pair could start a short-term recovery if there is a move above $40,000.
Bitcoin Price Gains Bearish Pace
Bitcoin price struggled to recover above the $43,500 level. BTC started another decline and traded below the $42,000 support level.
The bears took control and pushed the price below the $41,000 level. There was also a clear move below the $40,000 support zone and a close below the 100 hourly simple moving average. The price traded as low as $39,240 and is currently consolidating losses.
An immediate resistance on the upside is near the $39,700 level. There is also a steep bearish trend line forming with resistance near $39,700 on the hourly chart of the BTC/USD pair.
The first major resistance is forming near the $40,000 level. The next resistance could be near $40,200. It is close to the 23.6% Fib retracement level of the recent decline from the $43,415 swing high from the $39,240 low. A clear move above the $40,000 and $40,200 levels might start a short-term recovery wave.
Source: BTCUSD on TradingView.com
In the stated case, the price may perhaps rise towards the $41,350 resistance zone. It is near the 50% Fib retracement level of the recent decline from the $43,415 swing high from the $39,240 low.
More Losses in BTC?
If bitcoin fails to clear the $40,000 resistance zone, it could continue to move down. An immediate support on the downside is near the $39,250 level.
The next major support is seen near the $38,880 level. A downside break below the $38,880 support zone could increase selling pressure. In the stated case, the price could accelerate lower towards the $37,500 level in the coming sessions.
Technical indicators:
Hourly MACD – The MACD is now gaining pace in the bearish zone.
Hourly RSI (Relative Strength Index) – The RSI for BTC/USD is now in the oversold zone.
Major Support Levels – $39,250, followed by $38,880.
Major Resistance Levels – $39,700, $40,000 and $40,200.
Tags: bitcoinbtcusdBTCUSDTxbtusd
FeedzyRead More


Recent Posts
Crypto Daybook Americas: Bitcoin Breakout Lifts AI, Memecoins, Underscores Hedge Value
By Omkar Godbole (All times ET unless indicated otherwise) Bitcoin's censorship-resistant, decentralized setup empowers individuals…
BNB, SOL, XRP Spike Higher as Bitcoin ‘Digital Gold’ Narrative Makes a Comeback
Surging gold prices and bitcoin’s (BTC) relatively strong price action amid a global market sell-off…
Bitcoin’s Breakout Signals BTC Potentially Rallying to $90K-$92K: Technical Analysis
This is a daily technical analysis by CoinDesk analyst and Chartered Market Technician Omkar Godbole.…
Bitcoin Surges Above $87,000 In Sudden Move — Here’s The Catalyst
The Bitcoin price spiked to $87,400 on April 21, its highest level since March 29.…
Metaplanet Buys Another 330 BTC as BTC Moves Above $87K
Publicly-listed Metaplanet announced fresh bitcoin (BTC) purchases on Monday as BTC went above $87,300, reversing…
Bitcoin Price Still Has A Chance To Clear $90,000 If It Breaks This Level
The Bitcoin price continues to trend low and has failed to reclaim $90,000. The bears…