TA: Bitcoin Faces Hurdles, Why $45K Is The Key
Bitcoin attempted an upside break above $47,500 against the US Dollar. BTC failed to gain traction and corrected lower below $46,500.
Bitcoin is showing bearish signs and struggling below the $47,000 pivot level.
The price is trading below $46,500 and the 100 hourly simple moving average.
There was a break below a major breakout pattern with support near $46,400 on the hourly chart of the BTC/USD pair (data feed from Kraken).
The pair could extend decline and test the $45,000 support zone in the near term.
Bitcoin Price Struggles Below $47K
Bitcoin price started a decent increase from the $44,500 support zone. BTC climbed above the $45,000 and $45,500 resistance levels.
It even climbed above the $46,500 level and the 100 hourly simple moving average. However, the bears were active below the $47,500 resistance zone. A high was formed near $47,444 and the price started a fresh decline.
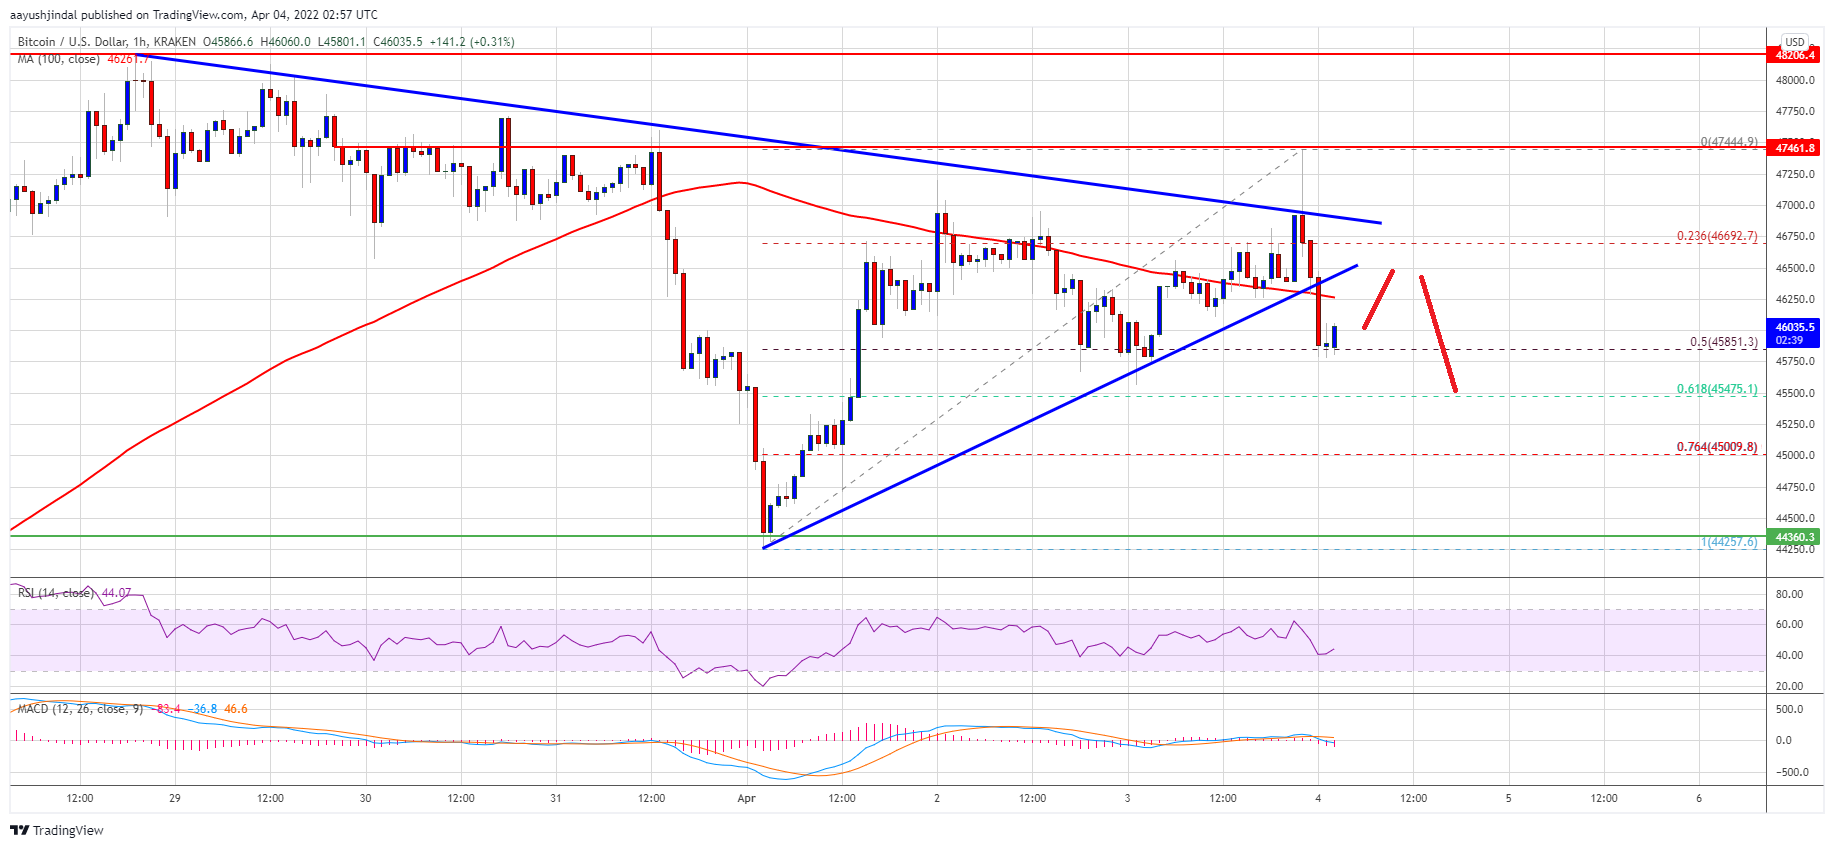
There was a clear move below the $46,500 support and the 100 hourly simple moving average. The price declined below the 23.6% Fib retracement level of the upward wave from the $44,257 swing low $47,444 high. Besides, there was a break below a major breakout pattern with support near $46,400 on the hourly chart of the BTC/USD pair.
Bitcoin price is now testing the 50% Fib retracement level of the upward wave from the $44,257 swing low $47,444 high. An immediate support on the downside is near the $45,850 level.
Source: BTCUSD on TradingView.com
The next major support is seen near the $45,500 level. The main support now sits near the $45,000 level. A downside break below the $45,000 support zone could increase selling pressure in the near term. In the stated case, the price could even decline below $44,250.
Upsides Capped in BTC?
If bitcoin remains stable above the $45,000 support level, it could attempt a fresh increase. An immediate resistance on the upside is near the $46,250 level and the 100 hourly SMA.
The next major resistance is near the $46,750 level. The key hurdle is now forming near the $47,500 level, above which the price might rise steadily. In the stated case, it could test the $48,500 resistance zone.
Technical indicators:
Hourly MACD – The MACD is slowly gaining pace in the bearish zone.
Hourly RSI (Relative Strength Index) – The RSI for BTC/USD is below the 50 level.
Major Support Levels – $45,250, followed by $45,000.
Major Resistance Levels – $46,250, $46,850 and $47,500.
Bitcoin attempted an upside break above $47,500 against the US Dollar. BTC failed to gain traction and corrected lower below $46,500.
Bitcoin is showing bearish signs and struggling below the $47,000 pivot level.
The price is trading below $46,500 and the 100 hourly simple moving average.
There was a break below a major breakout pattern with support near $46,400 on the hourly chart of the BTC/USD pair (data feed from Kraken).
The pair could extend decline and test the $45,000 support zone in the near term.
Bitcoin Price Struggles Below $47K
Bitcoin price started a decent increase from the $44,500 support zone. BTC climbed above the $45,000 and $45,500 resistance levels.
It even climbed above the $46,500 level and the 100 hourly simple moving average. However, the bears were active below the $47,500 resistance zone. A high was formed near $47,444 and the price started a fresh decline.
There was a clear move below the $46,500 support and the 100 hourly simple moving average. The price declined below the 23.6% Fib retracement level of the upward wave from the $44,257 swing low $47,444 high. Besides, there was a break below a major breakout pattern with support near $46,400 on the hourly chart of the BTC/USD pair.
Bitcoin price is now testing the 50% Fib retracement level of the upward wave from the $44,257 swing low $47,444 high. An immediate support on the downside is near the $45,850 level.
Source: BTCUSD on TradingView.com
The next major support is seen near the $45,500 level. The main support now sits near the $45,000 level. A downside break below the $45,000 support zone could increase selling pressure in the near term. In the stated case, the price could even decline below $44,250.
Upsides Capped in BTC?
If bitcoin remains stable above the $45,000 support level, it could attempt a fresh increase. An immediate resistance on the upside is near the $46,250 level and the 100 hourly SMA.
The next major resistance is near the $46,750 level. The key hurdle is now forming near the $47,500 level, above which the price might rise steadily. In the stated case, it could test the $48,500 resistance zone.
Technical indicators:
Hourly MACD – The MACD is slowly gaining pace in the bearish zone.
Hourly RSI (Relative Strength Index) – The RSI for BTC/USD is below the 50 level.
Major Support Levels – $45,250, followed by $45,000.
Major Resistance Levels – $46,250, $46,850 and $47,500.
Tags: bitcoinbtcusdBTCUSDTxbtusd
FeedzyRead More


Recent Posts
Bitcoin Price Bounces Back After Dip—Traders Eye Next Resistance Zone
Bitcoin price started a downside correction and tested the $94,000 zone. BTC is again rising…
Bitcoin Price Forecast: Key Scenarios For Tomorrow’s FOMC Decision
With the Federal Open Market Committee set to announce its May 7 policy decision, Bitcoin…
Bitcoin Races Above $97K on U.S./China Trade Deal Progress
A thawing in the trade stance from both the U.S. and China has sent risk…
Bitcoin Mining Giant Abandons Full-Hold Strategy, Unloads $40M In Crypto
Riot Platforms sold 475 Bitcoin worth $38.8 million in December as profit margins narrow throughout…
Bitcoin Network Activity In Bear Market Zone—Warning Or Opportunity?
On-chain data shows the Bitcoin network activity has recently declined into the bear market zone.…
Michael Saylor Explains Why Microsoft Should Buy Bitcoin
Bitcoin Magazine Michael Saylor Explains Why Microsoft Should Buy Bitcoin At Strategy World 2025, Michael…