Bitcoin remained in a bearish zone below $39,000 against the US Dollar. BTC could recover only if it manages to clear the $40,000 resistance zone.
Bitcoin is showing bearish signs below the $39,000 and $40,000 resistance levels.
The price is trading below $39,000 and the 100 hourly simple moving average.
There is a key triangle pattern forming with resistance near $39,000 on the hourly chart of the BTC/USD pair (data feed from Kraken).
The pair might start a recovery wave if there is a clear move above $39,000 and $40,000.
Bitcoin Price Remains in a Bearish Zone
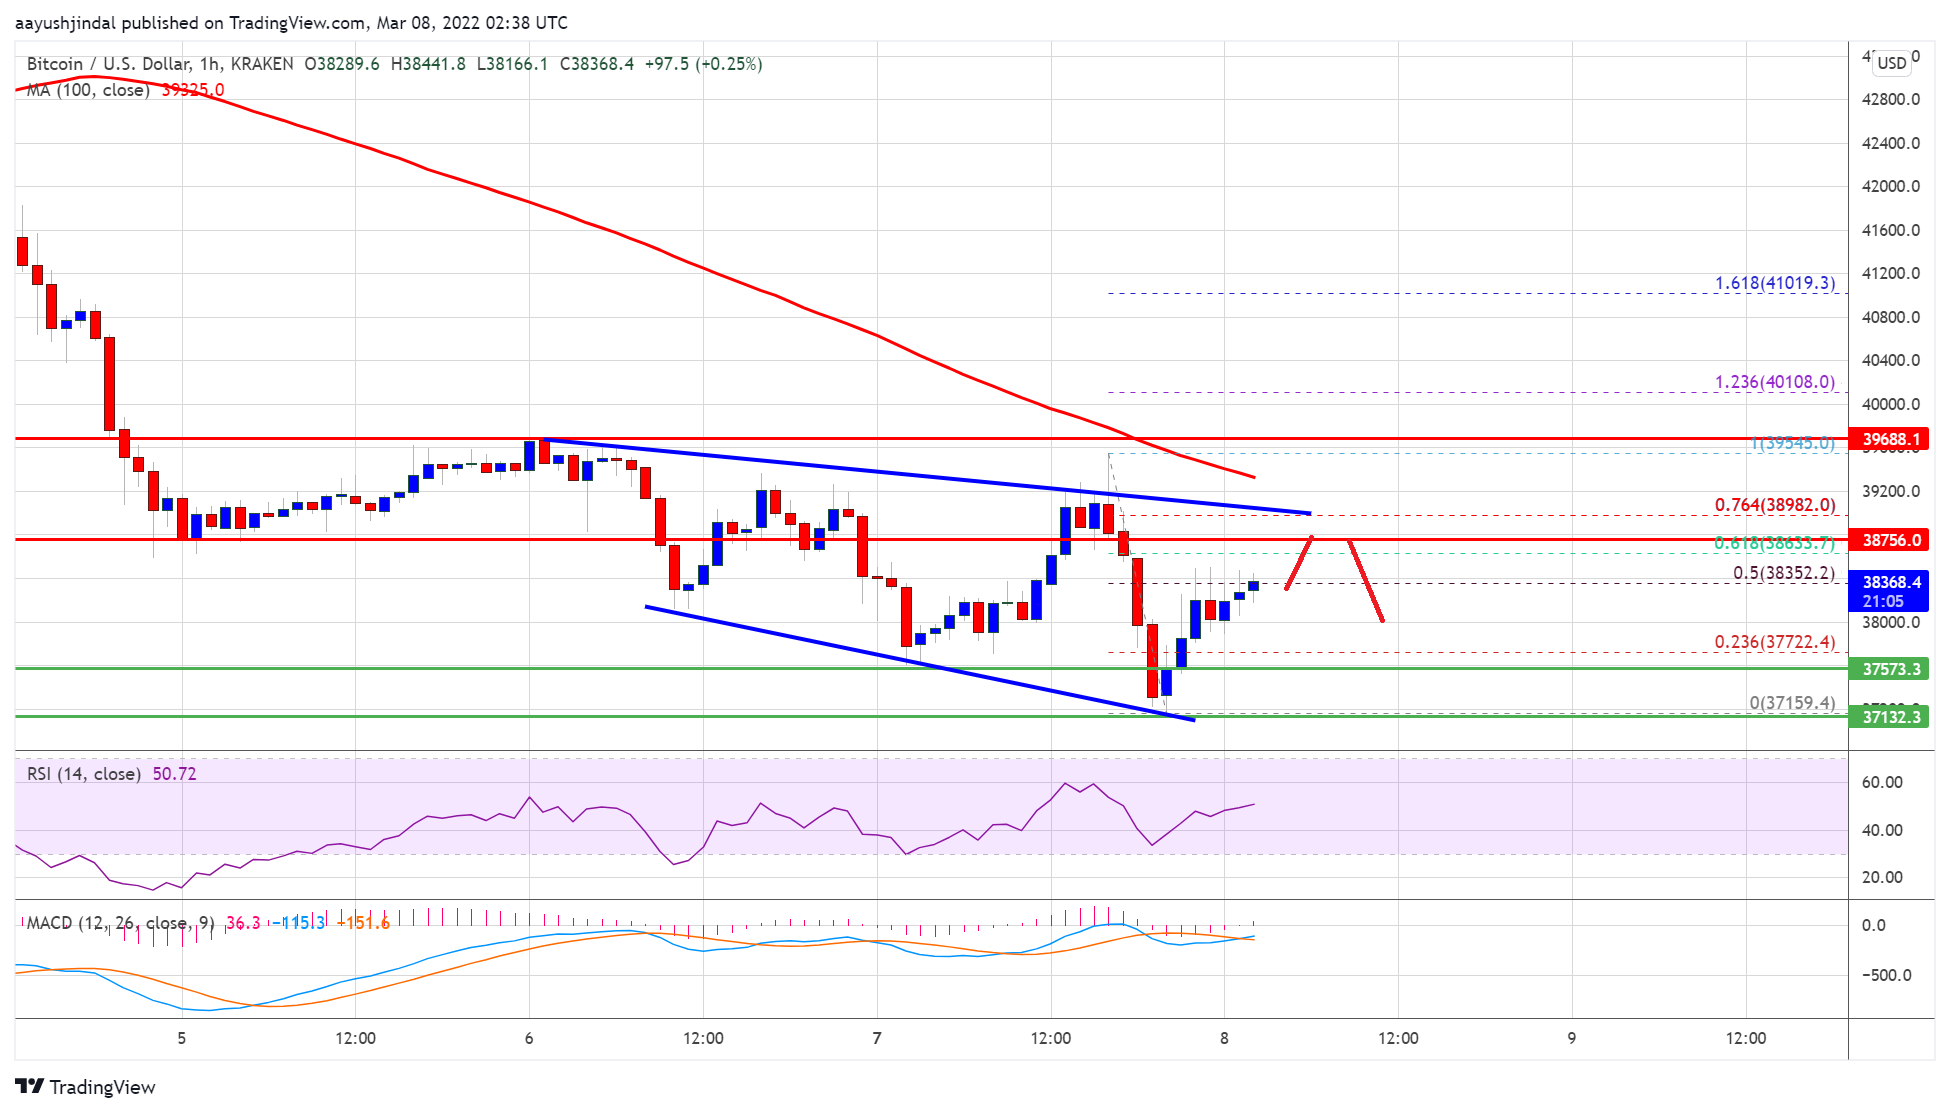
Bitcoin price settled below the $40,000 pivot level and the 100 hourly simple moving average. BTC even broke the $38,000 support level and traded as low as $37,159.
The bulls managed to protect the $37,000 support zone. It is now recovering losses and trading above $37,500. There was a move above the $38,000 resistance zone. The price is now testing the 50% Fib retracement level of the recent decline from the $39,545 swing high to $37,159 low.
On the upside, bitcoin price might face resistance near the $38,800 level. It is close to the 61.8% Fib retracement level of the recent decline from the $39,545 swing high to $37,159 low.
Source: BTCUSD on TradingView.com
There is also a key triangle pattern forming with resistance near $39,000 on the hourly chart of the BTC/USD pair. The next major resistance is near the $39,200 level and the 100 hourly simple moving average. A clear move above the $39,200 level might open the doors for a test of $40,000. A close above $40,000 could set the pace for more upsides in the near term.
More Losses in BTC?
If bitcoin fails to clear the $39,200 resistance zone, it could continue to move down. An immediate support on the downside is near the $38,000 zone.
The next major support is seen near the $37,200 level. If there is a downside break below the $37,200 support, the price might start another decline. In the stated case, there is a risk of a move towards the $35,500 level.
Technical indicators:
Hourly MACD – The MACD is now losing pace in the bearish zone.
Hourly RSI (Relative Strength Index) – The RSI for BTC/USD is now near the 50 level.
Major Support Levels – $38,000, followed by $37,200.
Major Resistance Levels – $38,800, $39,200 and $40,000.
Bitcoin remained in a bearish zone below $39,000 against the US Dollar. BTC could recover only if it manages to clear the $40,000 resistance zone.
Bitcoin is showing bearish signs below the $39,000 and $40,000 resistance levels.
The price is trading below $39,000 and the 100 hourly simple moving average.
There is a key triangle pattern forming with resistance near $39,000 on the hourly chart of the BTC/USD pair (data feed from Kraken).
The pair might start a recovery wave if there is a clear move above $39,000 and $40,000.
Bitcoin price settled below the $40,000 pivot level and the 100 hourly simple moving average. BTC even broke the $38,000 support level and traded as low as $37,159.
The bulls managed to protect the $37,000 support zone. It is now recovering losses and trading above $37,500. There was a move above the $38,000 resistance zone. The price is now testing the 50% Fib retracement level of the recent decline from the $39,545 swing high to $37,159 low.
On the upside, bitcoin price might face resistance near the $38,800 level. It is close to the 61.8% Fib retracement level of the recent decline from the $39,545 swing high to $37,159 low.
Source: BTCUSD on TradingView.com
There is also a key triangle pattern forming with resistance near $39,000 on the hourly chart of the BTC/USD pair. The next major resistance is near the $39,200 level and the 100 hourly simple moving average. A clear move above the $39,200 level might open the doors for a test of $40,000. A close above $40,000 could set the pace for more upsides in the near term.
If bitcoin fails to clear the $39,200 resistance zone, it could continue to move down. An immediate support on the downside is near the $38,000 zone.
The next major support is seen near the $37,200 level. If there is a downside break below the $37,200 support, the price might start another decline. In the stated case, there is a risk of a move towards the $35,500 level.
Technical indicators:
Hourly MACD – The MACD is now losing pace in the bearish zone.
Hourly RSI (Relative Strength Index) – The RSI for BTC/USD is now near the 50 level.
Major Support Levels – $38,000, followed by $37,200.
Major Resistance Levels – $38,800, $39,200 and $40,000.
Tags: bitcoinbtcusdBTCUSDTxbtusd
FeedzyRead More
Cathie Wood's investment management company ARK Invest snapped up $8.7 million of Coinbase (COIN) shares…
Bitcoin has seen a crash to the $87,000 level in the past day, but if…
The GitHub code you use to build a trendy application or patch existing bugs might…
Bitcoin’s price has continued its decline, dropping below several key levels in recent days. As…
Bitcoin (BTC) neared $89,000 in Asian morning hours after a 24-hour low of $86,200, slightly…
Tuesday was a rough day for the crypto market, as bitcoin (BTC) fell to three-month…