TA: Bitcoin Forms Bullish Pattern, Why BTC Could Accelerate Higher
Bitcoin remained well bid above the $29,350 support zone against the US Dollar. BTC started a fresh increase and cleared the $30,000 resistance zone.
Bitcoin started a recovery wave from the $29,350 support zone.
The price is now trading above the $30,000 level and the 100 hourly simple moving average.
There was a break above a major bearish trend line with resistance near $29,700 on the hourly chart of the BTC/USD pair (data feed from Kraken).
The pair could accelerate higher if it clears the $31,180 resistance zone.
Bitcoin Price Aims Higher
Bitcoin price remained well bid near the key $29,350 support zone. A base was formed near $29,350 and the price started a fresh increase. There was a clear move above the $29,800 and $30,000 resistance levels.
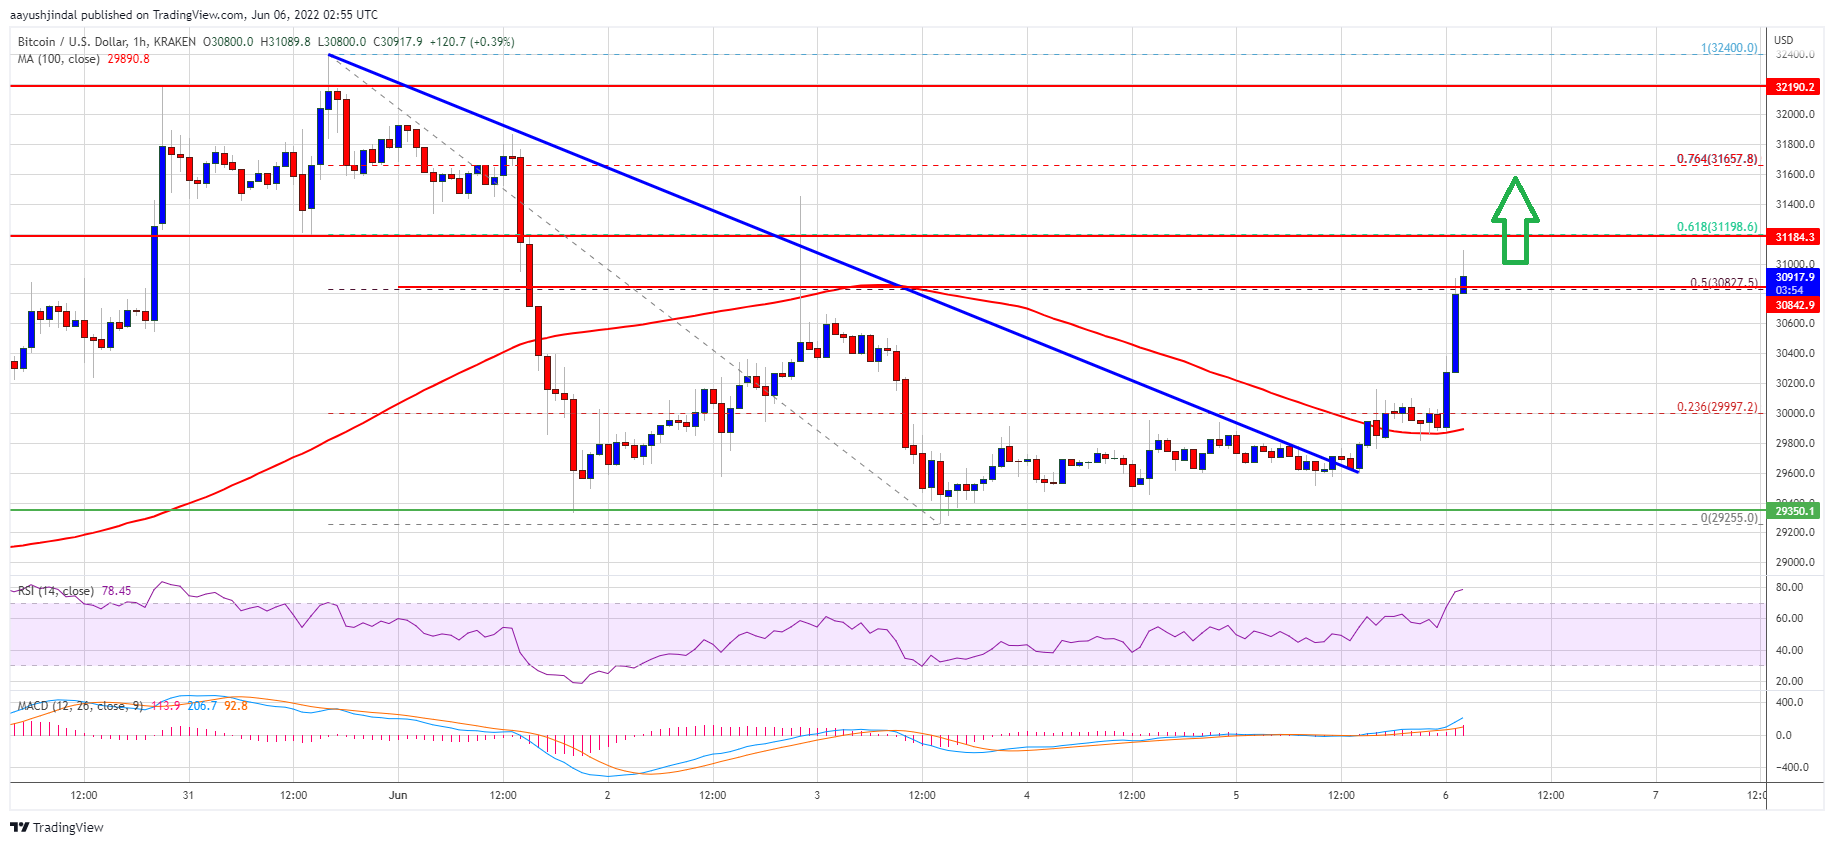
Besides, there was a break above a major bearish trend line with resistance near $29,700 on the hourly chart of the BTC/USD pair. The pair climbed above the $30,000 level and the 100 hourly simple moving average. There was a spike above the 50% Fib retracement level of the key decline from the $32,400 swing high to $29,255 low.
Bitcoin price is now consolidating near the $30,800 level. An immediate resistance on the upside is near the $31,180 level. It is near the 61.8% Fib retracement level of the key decline from the $32,400 swing high to $29,255 low.
Source: BTCUSD on TradingView.com
The next major resistance is near the $31,650 level. A clear move above the $31,650 resistance level could start another increase. In the stated case, the price could rise towards the $32,400 resistance. The next major resistance sits near the $33,000 level.
Dips Limited in BTC?
If bitcoin fails to clear the $31,180 resistance zone, it could a downside correction. An immediate support on the downside is near the $30,400 level.
The next major support is near the $29,950 level and the 100 hourly simple moving average. A downside break below the $29,950 support may perhaps spark another decline. In the stated case, the price could revisit the $29,350 support zone in the near term.
Technical indicators:
Hourly MACD – The MACD is now gaining pace in the bullish zone.
Hourly RSI (Relative Strength Index) – The RSI for BTC/USD is now well above the 50 level.
Major Support Levels – $30,400, followed by $29,950.
Major Resistance Levels – $31,180, $31,650 and $32,400.
Bitcoin remained well bid above the $29,350 support zone against the US Dollar. BTC started a fresh increase and cleared the $30,000 resistance zone.
Bitcoin started a recovery wave from the $29,350 support zone.
The price is now trading above the $30,000 level and the 100 hourly simple moving average.
There was a break above a major bearish trend line with resistance near $29,700 on the hourly chart of the BTC/USD pair (data feed from Kraken).
The pair could accelerate higher if it clears the $31,180 resistance zone.
Bitcoin Price Aims Higher
Bitcoin price remained well bid near the key $29,350 support zone. A base was formed near $29,350 and the price started a fresh increase. There was a clear move above the $29,800 and $30,000 resistance levels.
Besides, there was a break above a major bearish trend line with resistance near $29,700 on the hourly chart of the BTC/USD pair. The pair climbed above the $30,000 level and the 100 hourly simple moving average. There was a spike above the 50% Fib retracement level of the key decline from the $32,400 swing high to $29,255 low.
Bitcoin price is now consolidating near the $30,800 level. An immediate resistance on the upside is near the $31,180 level. It is near the 61.8% Fib retracement level of the key decline from the $32,400 swing high to $29,255 low.
Source: BTCUSD on TradingView.com
The next major resistance is near the $31,650 level. A clear move above the $31,650 resistance level could start another increase. In the stated case, the price could rise towards the $32,400 resistance. The next major resistance sits near the $33,000 level.
Dips Limited in BTC?
If bitcoin fails to clear the $31,180 resistance zone, it could a downside correction. An immediate support on the downside is near the $30,400 level.
The next major support is near the $29,950 level and the 100 hourly simple moving average. A downside break below the $29,950 support may perhaps spark another decline. In the stated case, the price could revisit the $29,350 support zone in the near term.
Technical indicators:
Hourly MACD – The MACD is now gaining pace in the bullish zone.
Hourly RSI (Relative Strength Index) – The RSI for BTC/USD is now well above the 50 level.
Major Support Levels – $30,400, followed by $29,950.
Major Resistance Levels – $31,180, $31,650 and $32,400.
Tags: bitcoinbtcusdBTCUSDTxbtusd
FeedzyRead More


Recent Posts
Bitcoin In The Spotlight As World Liberty Financial Debuts Strategic Reserve
By launching its Macro Strategic Reserve, World Liberty Financial (WLFI) has advanced significantly and strengthened…
Bitcoin Finds Price Stability: Reclaiming $101,000 Depends On This Level
Bitcoin (BTC) continues to move within its one-week range after recovering from its recent drop…
US to Release Jailed BTC-e Operator Vinnik in Russia Prisoner Swap
Alexander Vinnik, the jailed former operator of once mighty bitcoin exchange BTC-e, is being released…
Galoy Launches Bitcoin-Backed Loan Software, Sets Groundwork For Open-Source Banking
Founder: Nicolas Burtey Date Founded: September 2019 Location of Headquarters: United States Number of Employees:…
Goldman Sachs Disclosed Ownership of Bitcoin ETFs. Here’s Why It Doesn’t Mean Much
Bitcoin Twitter (or Bitcoin X) is having a moment after a 13F filing by Goldman…
Is Ethereum ‘Most Hated Rally’ About To Begin? Analyst Finds Bitcoin Cycle Similarities
After a relatively subdued price performance in 2024, Ethereum (ETH) could be on the verge…