Bitcoin started a steady recovery wave above $42,000 against the US Dollar. BTC tested $43,000 and the bulls might aim more upsides above $43,500.
Bitcoin is showing positive signs above the $42,000 support zone.
The price is trading above $42,000 and the 100 hourly simple moving average.
There is a key bullish trend line forming with support near $42,200 on the hourly chart of the BTC/USD pair (data feed from Kraken).
The pair might continue to recover and test the $44,000 resistance zone in the near term.
Bitcoin Price Starts Recovery
Bitcoin price formed a support base and climbed above the $42,000 resistance zone. BTC even traded above the $42,500 level and the 100 hourly simple moving average to move into a positive zone.
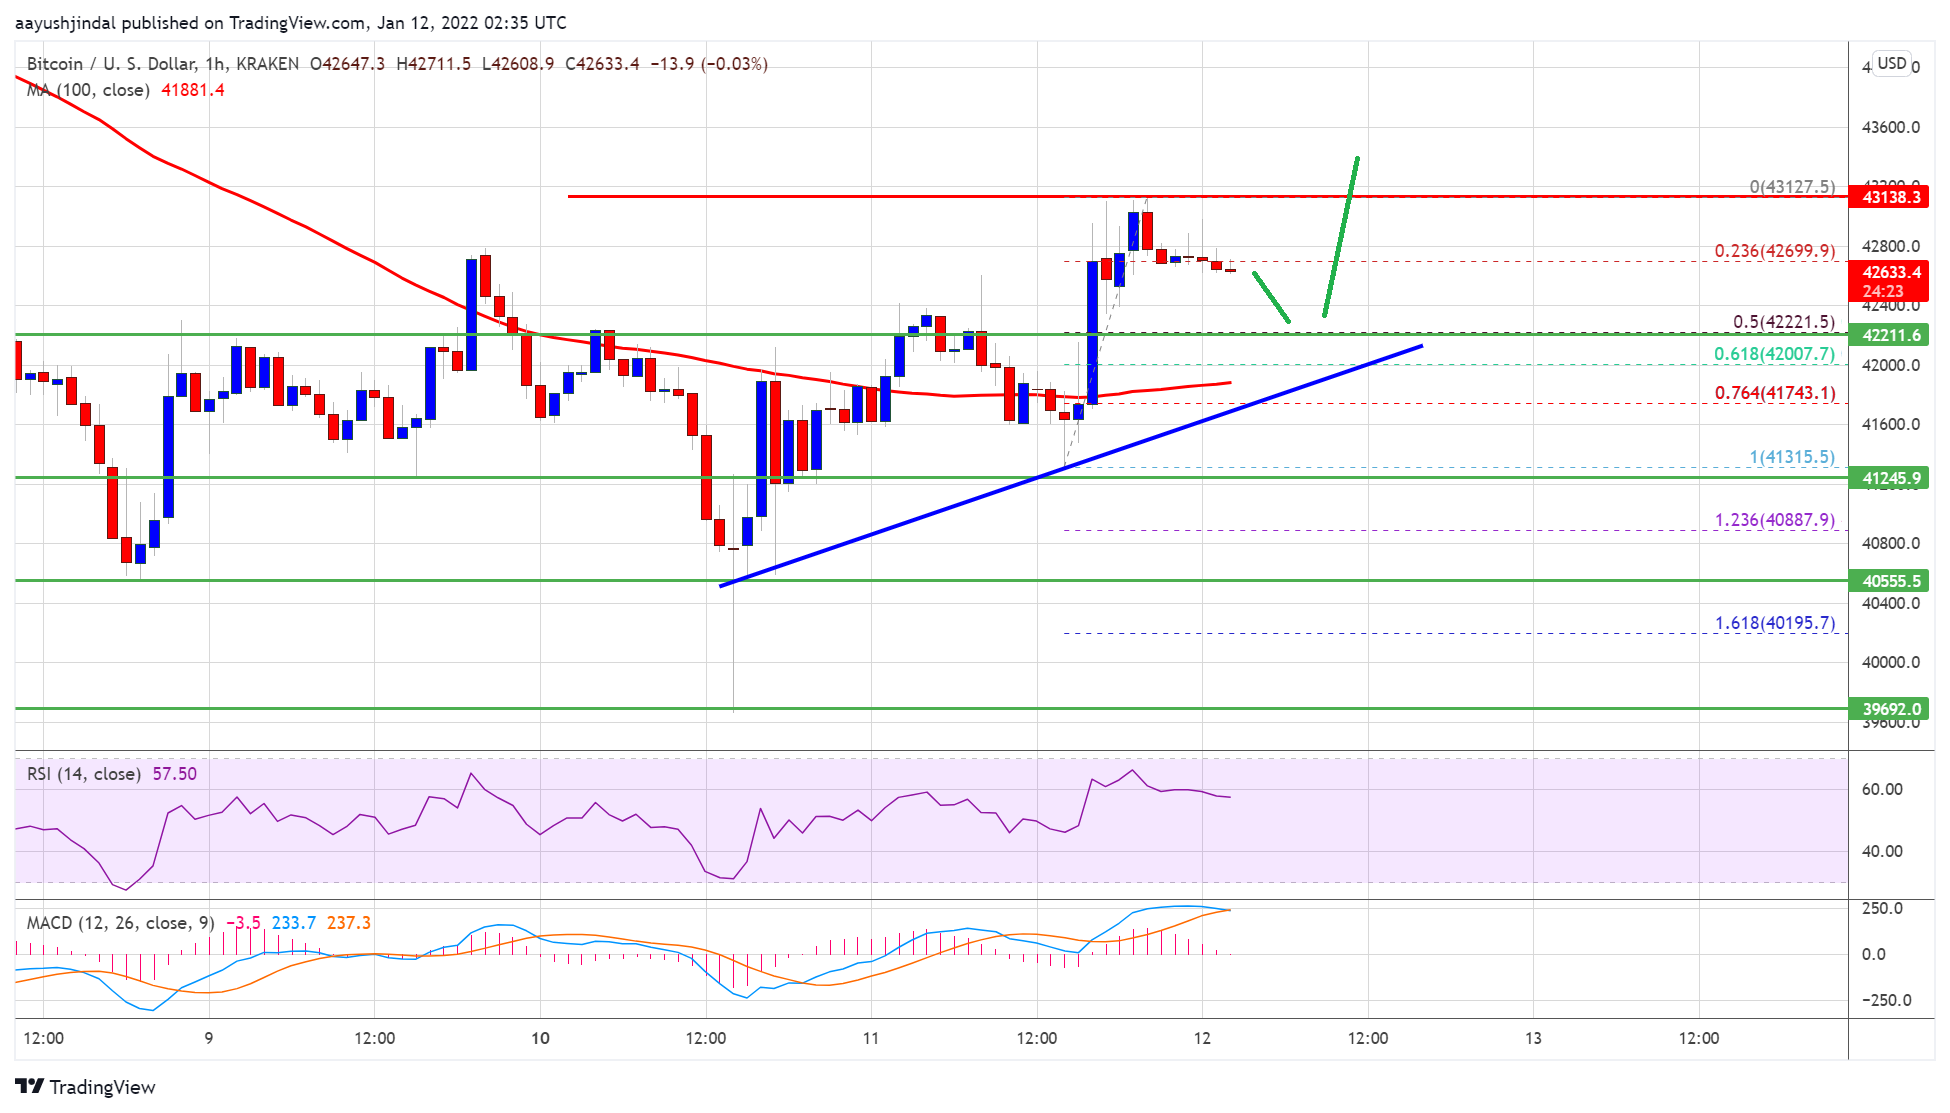
The upward move gained pace and the price spiked above the $43,000 level. A high is formed near $43,127 and the price is now correcting gains. It traded below the $42,800 support level. There was a move below the 23.6% Fib retracement level of the upward move from the $41,315 swing low to $43,127 high.
Besides, there is a key bullish trend line forming with support near $42,200 on the hourly chart of the BTC/USD pair. Bitcoin is now trading above $42,000 and the 100 hourly simple moving average.
Source: BTCUSD on TradingView.com
On the upside, an initial resistance is near the $43,000 level. The next major resistance is near the $43,200 level. Any more gains could pump the price towards the $44,000 level. The next major resistance is near the $45,000 level.
Fresh Decline in BTC?
If bitcoin fails to recover above $43,000, it could start a fresh decline. An immediate support on the downside is near the $42,500 zone. The first major support is near $42,200 and the bullish trend line.
The trend line is near the 50% Fib retracement level of the upward move from the $41,315 swing low to $43,127 high. A downside break below the trend line support could lead the price towards the $41,800 level and the 100 hourly SMA. Any more losses might push the price towards the $40,500 support zone in the coming sessions.
Technical indicators:
Hourly MACD – The MACD is now losing pace in the bullish zone.
Hourly RSI (Relative Strength Index) – The RSI for BTC/USD is now above the 50 level.
Major Support Levels – $42,200, followed by $41,800.
Major Resistance Levels – $43,000, $43,200 and $44,000.
Bitcoin started a steady recovery wave above $42,000 against the US Dollar. BTC tested $43,000 and the bulls might aim more upsides above $43,500.
Bitcoin is showing positive signs above the $42,000 support zone.
The price is trading above $42,000 and the 100 hourly simple moving average.
There is a key bullish trend line forming with support near $42,200 on the hourly chart of the BTC/USD pair (data feed from Kraken).
The pair might continue to recover and test the $44,000 resistance zone in the near term.
Bitcoin price formed a support base and climbed above the $42,000 resistance zone. BTC even traded above the $42,500 level and the 100 hourly simple moving average to move into a positive zone.
The upward move gained pace and the price spiked above the $43,000 level. A high is formed near $43,127 and the price is now correcting gains. It traded below the $42,800 support level. There was a move below the 23.6% Fib retracement level of the upward move from the $41,315 swing low to $43,127 high.
Besides, there is a key bullish trend line forming with support near $42,200 on the hourly chart of the BTC/USD pair. Bitcoin is now trading above $42,000 and the 100 hourly simple moving average.
Source: BTCUSD on TradingView.com
On the upside, an initial resistance is near the $43,000 level. The next major resistance is near the $43,200 level. Any more gains could pump the price towards the $44,000 level. The next major resistance is near the $45,000 level.
If bitcoin fails to recover above $43,000, it could start a fresh decline. An immediate support on the downside is near the $42,500 zone. The first major support is near $42,200 and the bullish trend line.
The trend line is near the 50% Fib retracement level of the upward move from the $41,315 swing low to $43,127 high. A downside break below the trend line support could lead the price towards the $41,800 level and the 100 hourly SMA. Any more losses might push the price towards the $40,500 support zone in the coming sessions.
Technical indicators:
Hourly MACD – The MACD is now losing pace in the bullish zone.
Hourly RSI (Relative Strength Index) – The RSI for BTC/USD is now above the 50 level.
Major Support Levels – $42,200, followed by $41,800.
Major Resistance Levels – $43,000, $43,200 and $44,000.
Tags: bitcoinbtcusdBTCUSDTxbtusd
FeedzyRead More
Bitcoin price is struggling to clear the $100,000 resistance zone. BTC is again moving lower…
The price of Bitcoin (BTC) has shown only sideways movement in the last day resulting…
A sluggish Bitcoin price performance has not been the only disappointing theme for the largest…
World Liberty Financial, Trump’s crypto company, is making moves again. It recently bought another $1.4M…
Disclaimer: The analyst who wrote this piece owns shares of Strategy (MSTR) Strategy (MSTR) could…
Peter Brandt, a seasoned trader, has dismissed optimistic predictions in the wake of Bitcoin’s recent…