TA: Bitcoin Holds Uptrend Support, What Could Trigger Sharp Decline
Bitcoin started a fresh increase above the $41,000 resistance against the US Dollar. BTC is struggling near $41,500, but it is still above the $40,000 support.
Bitcoin is trading well above the $40,000 support zone.
The price is trading above $39,800 and the 100 hourly simple moving average.
There is a key bullish trend line forming with support near $40,050 on the hourly chart of the BTC/USD pair (data feed from Kraken).
The pair could start a sharp decline if there is a clear move below the $39,000 support.
Bitcoin Price Remains Supported
Bitcoin price remained below the $41,500 resistance level. BTC formed a high near $41,470 and is currently moving lower. There was a decline below the $41,000 level.
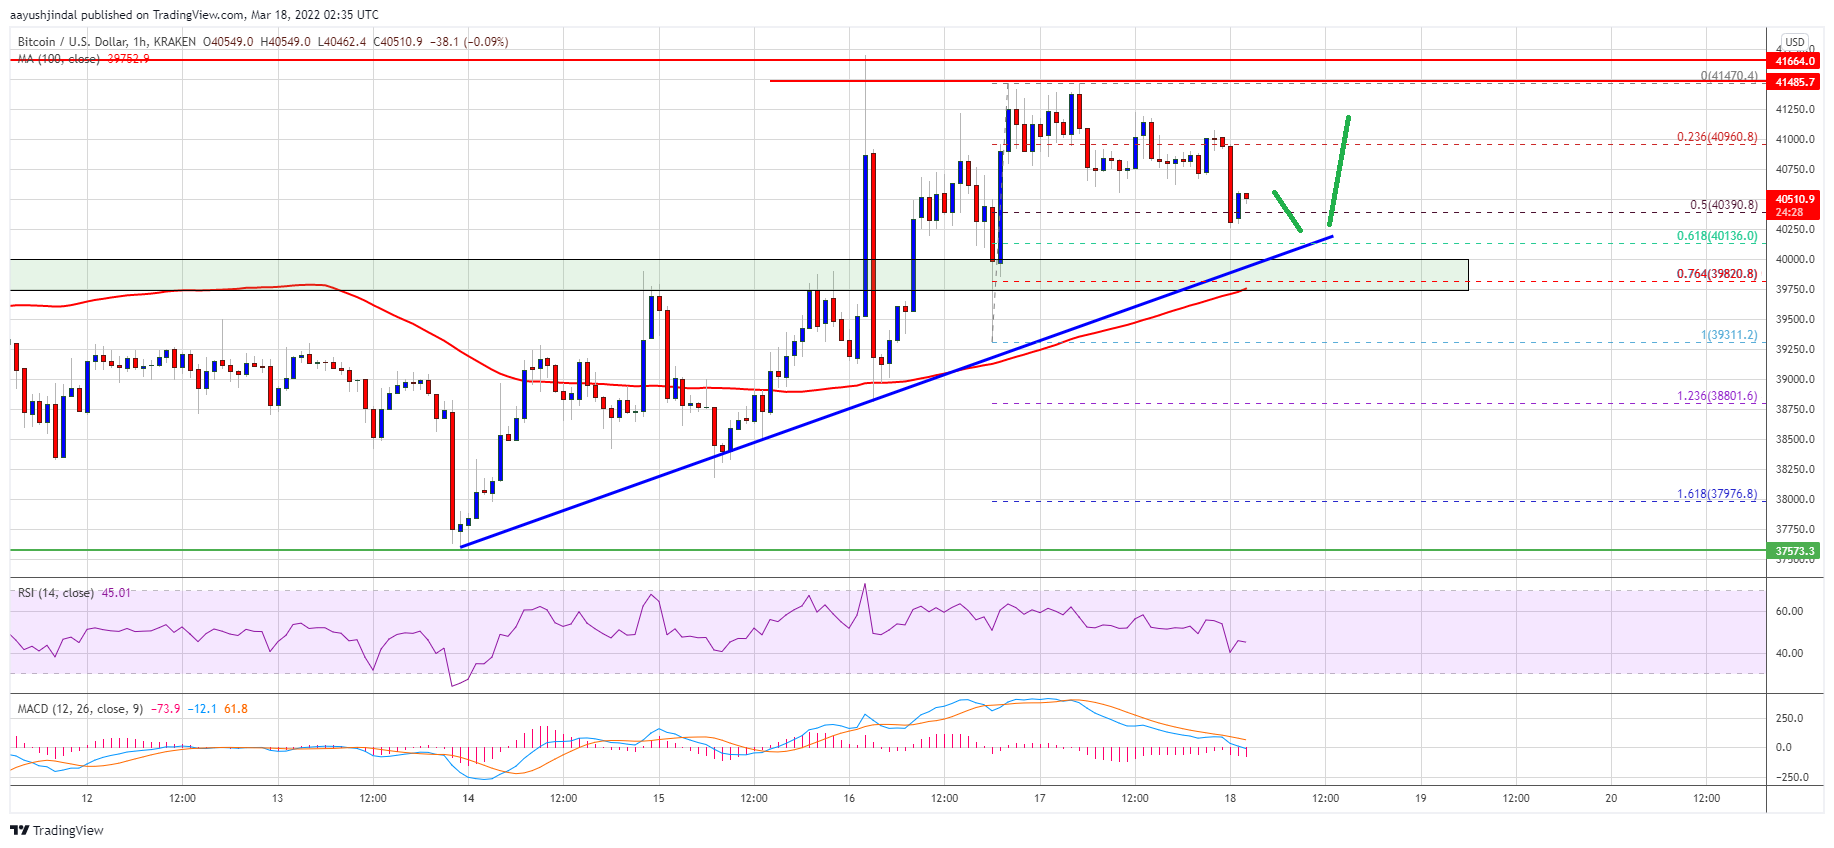
The price also traded below the 23.6% Fib retracement level of the upward move from the $39,311 swing low to $41,470 high. However, the price is still trading well above $39,800 and the 100 hourly simple moving average.
It is trading near the 50% Fib retracement level of the upward move from the $39,311 swing low to $41,470 high. There is also a key bullish trend line forming with support near $40,050 on the hourly chart of the BTC/USD pair.
Source: BTCUSD on TradingView.com
On the upside, the price is facing resistance near the $41,000 level. The next major resistance could be near the recent high or $41,500. A successful break and close above the $41,500 level might start a steady increase. In the stated case, the price might rise towards the $42,000 level. Any more gains might send the price towards the $42,500 level in the near term.
Downside Break in BTC?
If bitcoin fails to clear the $41,500 resistance zone, it could continue to move down. An immediate support on the downside is near the $40,350 zone.
The next major support is seen near the $40,000 level and the trend line. The main support is still near the $39,000 zone and the 100 hourly simple moving average. A downside break below the $39,000 support zone could start a sharp decline. In this case, the price may perhaps decline towards the $37,500 level.
Technical indicators:
Hourly MACD – The MACD is now gaining pace in the bearish zone.
Hourly RSI (Relative Strength Index) – The RSI for BTC/USD is now below the 50 level.
Major Support Levels – $40,000, followed by $39,000.
Major Resistance Levels – $41,000, $41,500 and $42,500.
Bitcoin started a fresh increase above the $41,000 resistance against the US Dollar. BTC is struggling near $41,500, but it is still above the $40,000 support.
Bitcoin is trading well above the $40,000 support zone.
The price is trading above $39,800 and the 100 hourly simple moving average.
There is a key bullish trend line forming with support near $40,050 on the hourly chart of the BTC/USD pair (data feed from Kraken).
The pair could start a sharp decline if there is a clear move below the $39,000 support.
Bitcoin Price Remains Supported
Bitcoin price remained below the $41,500 resistance level. BTC formed a high near $41,470 and is currently moving lower. There was a decline below the $41,000 level.
The price also traded below the 23.6% Fib retracement level of the upward move from the $39,311 swing low to $41,470 high. However, the price is still trading well above $39,800 and the 100 hourly simple moving average.
It is trading near the 50% Fib retracement level of the upward move from the $39,311 swing low to $41,470 high. There is also a key bullish trend line forming with support near $40,050 on the hourly chart of the BTC/USD pair.
Source: BTCUSD on TradingView.com
On the upside, the price is facing resistance near the $41,000 level. The next major resistance could be near the recent high or $41,500. A successful break and close above the $41,500 level might start a steady increase. In the stated case, the price might rise towards the $42,000 level. Any more gains might send the price towards the $42,500 level in the near term.
Downside Break in BTC?
If bitcoin fails to clear the $41,500 resistance zone, it could continue to move down. An immediate support on the downside is near the $40,350 zone.
The next major support is seen near the $40,000 level and the trend line. The main support is still near the $39,000 zone and the 100 hourly simple moving average. A downside break below the $39,000 support zone could start a sharp decline. In this case, the price may perhaps decline towards the $37,500 level.
Technical indicators:
Hourly MACD – The MACD is now gaining pace in the bearish zone.
Hourly RSI (Relative Strength Index) – The RSI for BTC/USD is now below the 50 level.
Major Support Levels – $40,000, followed by $39,000.
Major Resistance Levels – $41,000, $41,500 and $42,500.
Tags: bitcoinbtcusdBTCUSDTxbtusd
FeedzyRead More


Recent Posts
Is This the Final Shakeout Before Bitcoin’s Next Big Move? Analysts Break It Down
Bitcoin’s recent price action has shown signs of stagnation, with the asset hovering around the…
Bitcoin Recovery in Motion? Analyst Tracks Key Divergence Between US and Asia Market
Bitcoin appears to be entering a period of consolidation following a brief burst of upward…
Bitcoin Realized Cap Sets New Record, But Momentum Fades
On-chain data shows the Bitcoin Realized Cap has surged to a new all-time high (ATH)…
Bitcoin Price Gears Up for Next Leg Higher—Upside Potential Builds
Bitcoin price is slowly moving higher above the $83,500 zone. BTC must clear the $85,200…
Bitcoin Following Gold’s Footsteps? Analyst Sets Mid-Term Target At $155,000
As gold continues to set new all-time highs (ATH) – trading at $3,333 per ounce…
Bitcoin Price To Break $125,000 But Sell Everything In October, Analyst Warns
Bitcoin’s price action in recent weeks has been mostly highlighted by a trading range between…