TA: Bitcoin Jumps 5%, Why BTC Could Offer Trade Openings On Dips
Bitcoin gained pace and cleared the $19,500 resistance against the US Dollar. BTC is now facing resistance and might correct lower to $19,500 in the short-term.
Bitcoin gained pace above the $19,500 and $19,600 resistance levels.
The price is now trading above the $20,000 level and the 100 hourly simple moving average.
There was a move above a key bearish trend line with resistance near $19,460 on the hourly chart of the BTC/USD pair (data feed from Kraken).
The pair tested the $20,500 resistance zone and might correct in the short-term.
Bitcoin Price Gains Pace
Bitcoin price formed a base above the $18,720 support zone. As a result, BTC started a decent increase and broke the $19,500 resistance zone.
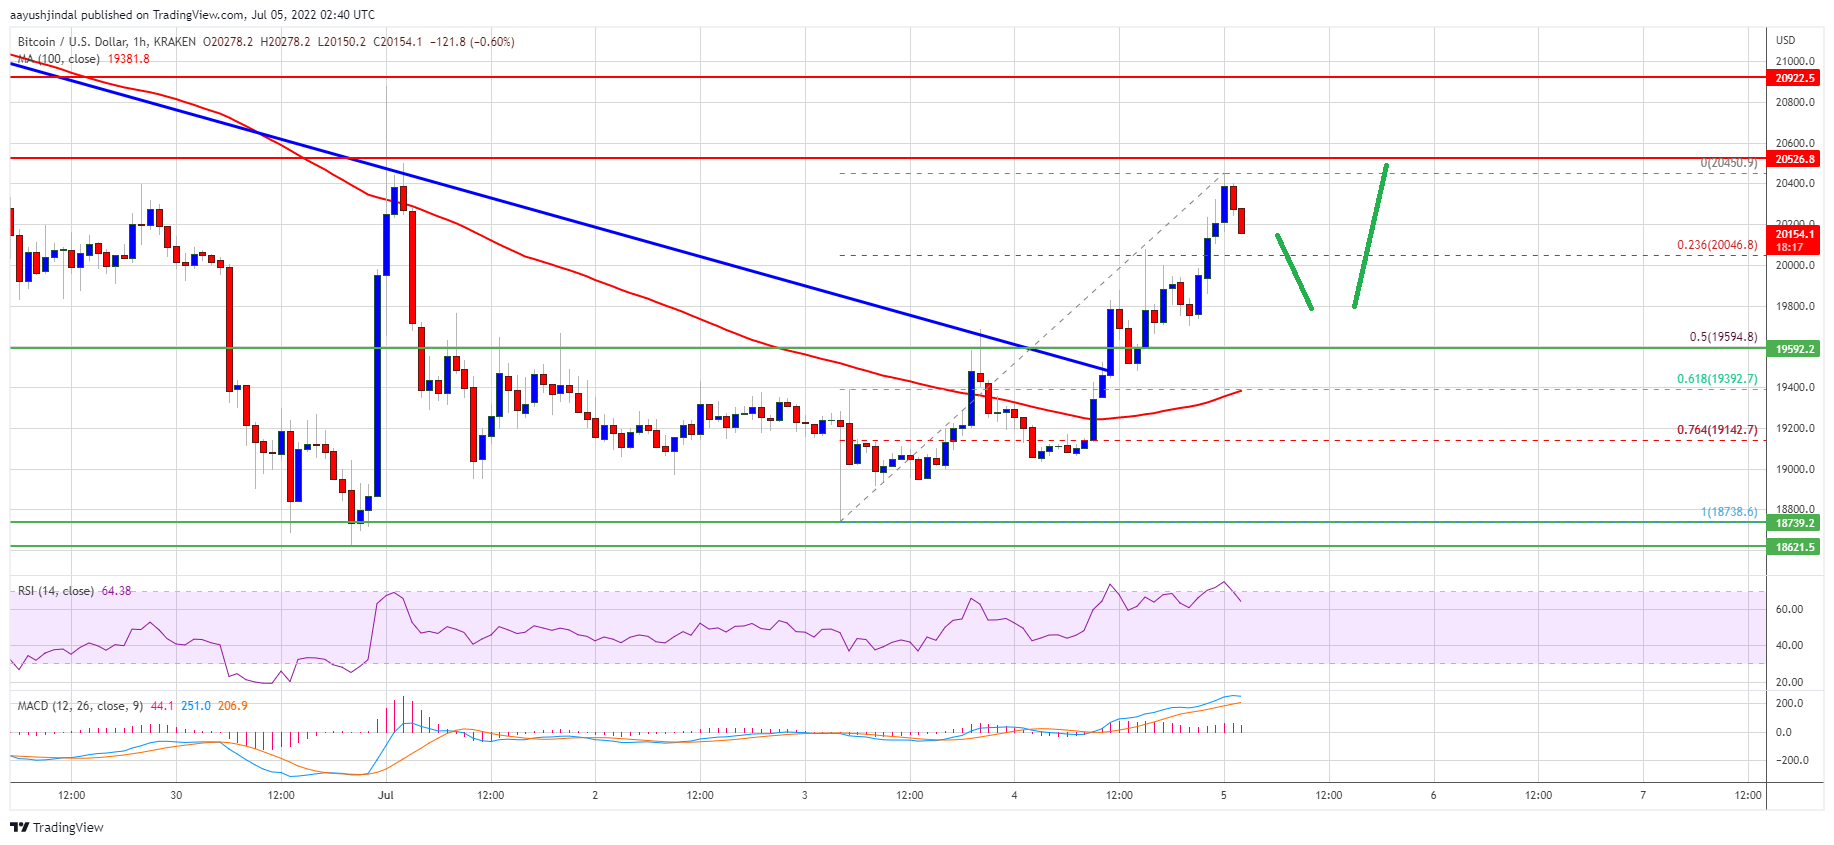
There was a clear move above a key bearish trend line with resistance near $19,460 on the hourly chart of the BTC/USD pair. The price even broke the $20,000 resistance and settled above the 100 hourly simple moving average.
Bitcoin climbed above the 76.4% Fib retracement level of the key drop from the $20,500 swing high to $18,735 low. However, the bulls struggled to pump the price above the $20,500 resistance zone.
A high is formed near $20,450 and the price is consolidating gains. It is trading above the 23.6% Fib retracement level of the recent increase from the $18,738 swing low to $20,450 high. On the upside, the price is facing resistance near the $20,450 and $20,500 levels.
Source: BTCUSD on TradingView.com
The next key resistance is near the $20,920 zone. A clear move above the $20,920 resistance zone could push the price further higher. In the stated case, the price could rise towards the $21,500 level. The next major resistance sits near the $22,200 level.
Fresh Decline in BTC?
If bitcoin fails to clear the $20,500 resistance zone, it could start another decline. An immediate support on the downside is near the $20,000 level.
The next major support now sits near the $19,600 level or the 50% Fib retracement level of the recent increase from the $18,738 swing low to $20,450 high, below which the price could decline heavily. In the stated case, the price may perhaps drop towards the $18,720 level.
Technical indicators:
Hourly MACD – The MACD is now losing pace in the bullish zone.
Hourly RSI (Relative Strength Index) – The RSI for BTC/USD is now well above the 50 level.
Major Support Levels – $20,000, followed by $19,500.
Major Resistance Levels – $20,500, $20,920 and $21,500.
Bitcoin gained pace and cleared the $19,500 resistance against the US Dollar. BTC is now facing resistance and might correct lower to $19,500 in the short-term.
Bitcoin gained pace above the $19,500 and $19,600 resistance levels.
The price is now trading above the $20,000 level and the 100 hourly simple moving average.
There was a move above a key bearish trend line with resistance near $19,460 on the hourly chart of the BTC/USD pair (data feed from Kraken).
The pair tested the $20,500 resistance zone and might correct in the short-term.
Bitcoin Price Gains Pace
Bitcoin price formed a base above the $18,720 support zone. As a result, BTC started a decent increase and broke the $19,500 resistance zone.
There was a clear move above a key bearish trend line with resistance near $19,460 on the hourly chart of the BTC/USD pair. The price even broke the $20,000 resistance and settled above the 100 hourly simple moving average.
Bitcoin climbed above the 76.4% Fib retracement level of the key drop from the $20,500 swing high to $18,735 low. However, the bulls struggled to pump the price above the $20,500 resistance zone.
A high is formed near $20,450 and the price is consolidating gains. It is trading above the 23.6% Fib retracement level of the recent increase from the $18,738 swing low to $20,450 high. On the upside, the price is facing resistance near the $20,450 and $20,500 levels.
Source: BTCUSD on TradingView.com
The next key resistance is near the $20,920 zone. A clear move above the $20,920 resistance zone could push the price further higher. In the stated case, the price could rise towards the $21,500 level. The next major resistance sits near the $22,200 level.
Fresh Decline in BTC?
If bitcoin fails to clear the $20,500 resistance zone, it could start another decline. An immediate support on the downside is near the $20,000 level.
The next major support now sits near the $19,600 level or the 50% Fib retracement level of the recent increase from the $18,738 swing low to $20,450 high, below which the price could decline heavily. In the stated case, the price may perhaps drop towards the $18,720 level.
Technical indicators:
Hourly MACD – The MACD is now losing pace in the bullish zone.
Hourly RSI (Relative Strength Index) – The RSI for BTC/USD is now well above the 50 level.
Major Support Levels – $20,000, followed by $19,500.
Major Resistance Levels – $20,500, $20,920 and $21,500.
Tags: bitcoinbtcusdBTCUSDTxbtusd
FeedzyRead More


Recent Posts
Fed Stagflation Risk Signal Could Be Bullish for Bitcoin, Analyst Says
The Federal Reserve is growing increasingly alert to stagflation risks—an uneasy mix of slowing growth…
Scotland’s Lomond School and Saifedean Ammous Launch New Bitcoin Scholarship Program
Bitcoin Magazine Scotland’s Lomond School and Saifedean Ammous Launch New Bitcoin Scholarship Program In a…
Trump Crypto Advisor David Bailey In Talks to Launch Bitcoin Investment Company: The Information
David Bailey, CEO of BTC Inc., the owner of Bitcoin Magazine, is planning to launch…
Revolut Integrates Lightspark for Lightning-Fast Bitcoin Payments in the UK and Europe
Bitcoin Magazine Revolut Integrates Lightspark for Lightning-Fast Bitcoin Payments in the UK and Europe Revolut,…
Strategy CEO Phong Le Reveals How MSTR Is Rewriting Corporate Finance In New Bitcoin Presentation
Bitcoin Magazine Strategy CEO Phong Le Reveals How MSTR Is Rewriting Corporate Finance In New…
Fidelity’s Chris Kuiper Presents “The Investment Case For Bitcoin” At Corporate Conference
Bitcoin Magazine Fidelity’s Chris Kuiper Presents “The Investment Case For Bitcoin” At Corporate Conference Speaking…