Bitcoin gained bearish momentum below $40,000 against the US Dollar. BTC is at risk of more downsides towards the $37,200 and $36,600 levels.
Bitcoin started another decline below the $40,000 and $39,000 levels.
The price is trading below $39,000 and the 100 hourly simple moving average.
There is a key bearish trend line forming with resistance near $39,000 on the hourly chart of the BTC/USD pair (data feed from Kraken).
The pair might continue to move down unless the bulls able to push the price above $39,550.
Bitcoin Price Extends Decline
Bitcoin price struggled to stay above the $40,000 support zone. As a result, BTC extended decline below the $39,550 support zone and the 100 hourly simple moving average.
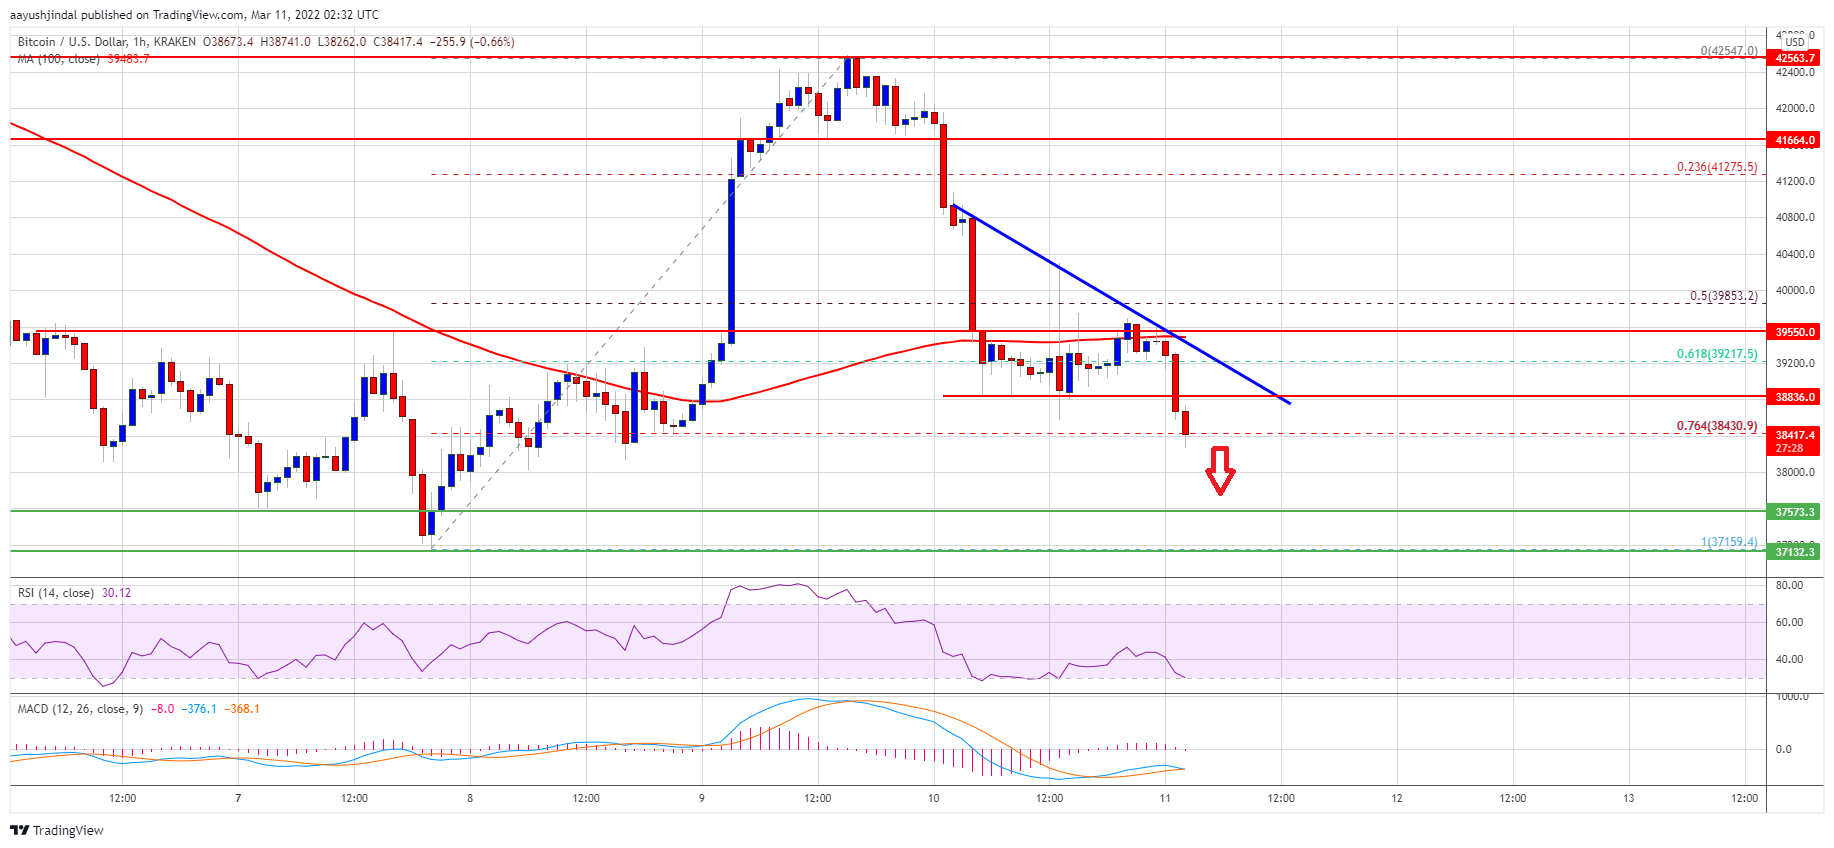
The price traded below the 61.8% Fib retracement level of the main increase from the $37,160 swing low to $42,550 swing high. It is now showing a few bearish signs below the $39,200 and $39,000 support levels.
Bitcoin is also testing the 76.4% Fib retracement level of the main increase from the $37,160 swing low to $42,550 swing high at $38,430. If there is a minor recovery wave, the price might face resistance near the $38,850 level. The first major resistance on the upside is near the $39,000 zone.
There is also a key bearish trend line forming with resistance near $39,000 on the hourly chart of the BTC/USD pair. If there is a clear move above the $39,000 resistance zone, the price might rise further.
Source: BTCUSD on TradingView.com
The next major resistance sits near the $39,550 level and the 100 hourly SMA, above which there are chances of a steady recovery wave above the $40,000 resistance zone.
More Losses in BTC?
If bitcoin fails to clear the $39,550 resistance zone, it could continue to move down. An immediate support on the downside is near the $38,400 zone.
The next major support is seen near the $38,000 level. The main support sits near the last swing low at $37,140. If there is a downside break below the $37,140 support, the price might gain bearish momentum. In the stated case, it could dive towards the $36,600 level or even $36,000.
Technical indicators:
Hourly MACD – The MACD is now gaining pace in the bearish zone.
Hourly RSI (Relative Strength Index) – The RSI for BTC/USD is now below the 50 level.
Major Support Levels – $38,000, followed by $37,140.
Major Resistance Levels – $39,000, $39,550 and $40,000.
Bitcoin gained bearish momentum below $40,000 against the US Dollar. BTC is at risk of more downsides towards the $37,200 and $36,600 levels.
Bitcoin started another decline below the $40,000 and $39,000 levels.
The price is trading below $39,000 and the 100 hourly simple moving average.
There is a key bearish trend line forming with resistance near $39,000 on the hourly chart of the BTC/USD pair (data feed from Kraken).
The pair might continue to move down unless the bulls able to push the price above $39,550.
Bitcoin price struggled to stay above the $40,000 support zone. As a result, BTC extended decline below the $39,550 support zone and the 100 hourly simple moving average.
The price traded below the 61.8% Fib retracement level of the main increase from the $37,160 swing low to $42,550 swing high. It is now showing a few bearish signs below the $39,200 and $39,000 support levels.
Bitcoin is also testing the 76.4% Fib retracement level of the main increase from the $37,160 swing low to $42,550 swing high at $38,430. If there is a minor recovery wave, the price might face resistance near the $38,850 level. The first major resistance on the upside is near the $39,000 zone.
There is also a key bearish trend line forming with resistance near $39,000 on the hourly chart of the BTC/USD pair. If there is a clear move above the $39,000 resistance zone, the price might rise further.
Source: BTCUSD on TradingView.com
The next major resistance sits near the $39,550 level and the 100 hourly SMA, above which there are chances of a steady recovery wave above the $40,000 resistance zone.
If bitcoin fails to clear the $39,550 resistance zone, it could continue to move down. An immediate support on the downside is near the $38,400 zone.
The next major support is seen near the $38,000 level. The main support sits near the last swing low at $37,140. If there is a downside break below the $37,140 support, the price might gain bearish momentum. In the stated case, it could dive towards the $36,600 level or even $36,000.
Technical indicators:
Hourly MACD – The MACD is now gaining pace in the bearish zone.
Hourly RSI (Relative Strength Index) – The RSI for BTC/USD is now below the 50 level.
Major Support Levels – $38,000, followed by $37,140.
Major Resistance Levels – $39,000, $39,550 and $40,000.
Tags: bitcoinbtcusdBTCUSDTxbtusd
FeedzyRead More
Anyone paying attention to public bitcoin miner markets will know that artificial intelligence (AI) and…
By Omkar Godbole (All times ET unless indicated otherwise) The crypto market is a sea…
Crypto traders are buying bitcoin (BTC) on Kraken, one of the 10 biggest cryptocurrency exchanges,…
Bitcoin (BTC) dipped below $89,000 during Tuesday's early European hours as Nasdaq futures pointed to…
Crypto bulls nursed at least $1.2 billion in losses over the past 24 hours as…
U.S. spot-listed bitcoin (BTC) exchange-traded funds (ETFs) experienced the second-biggest outflows of the year on…