TA: Bitcoin Plunges Below Key Support, Turn Sell On Rallies
Bitcoin declined sharply below the $45,500 support against the US Dollar. BTC could recover, but upsides might be limited above $45,000.
Bitcoin gained pace below the key $45,500 support zone.
The price is trading below $45,000 and the 100 hourly simple moving average.
There is a crucial bearish trend line forming with resistance near $46,800 on the hourly chart of the BTC/USD pair (data feed from Kraken).
The pair might start recovery, but the bears might remain active near the $45,000 zone.
Bitcoin Price Dives 5%
Bitcoin price failed to clear the $47,500 resistance zone and started a major decline. BTC declined heavily below the $46,000 and $45,00 levels.
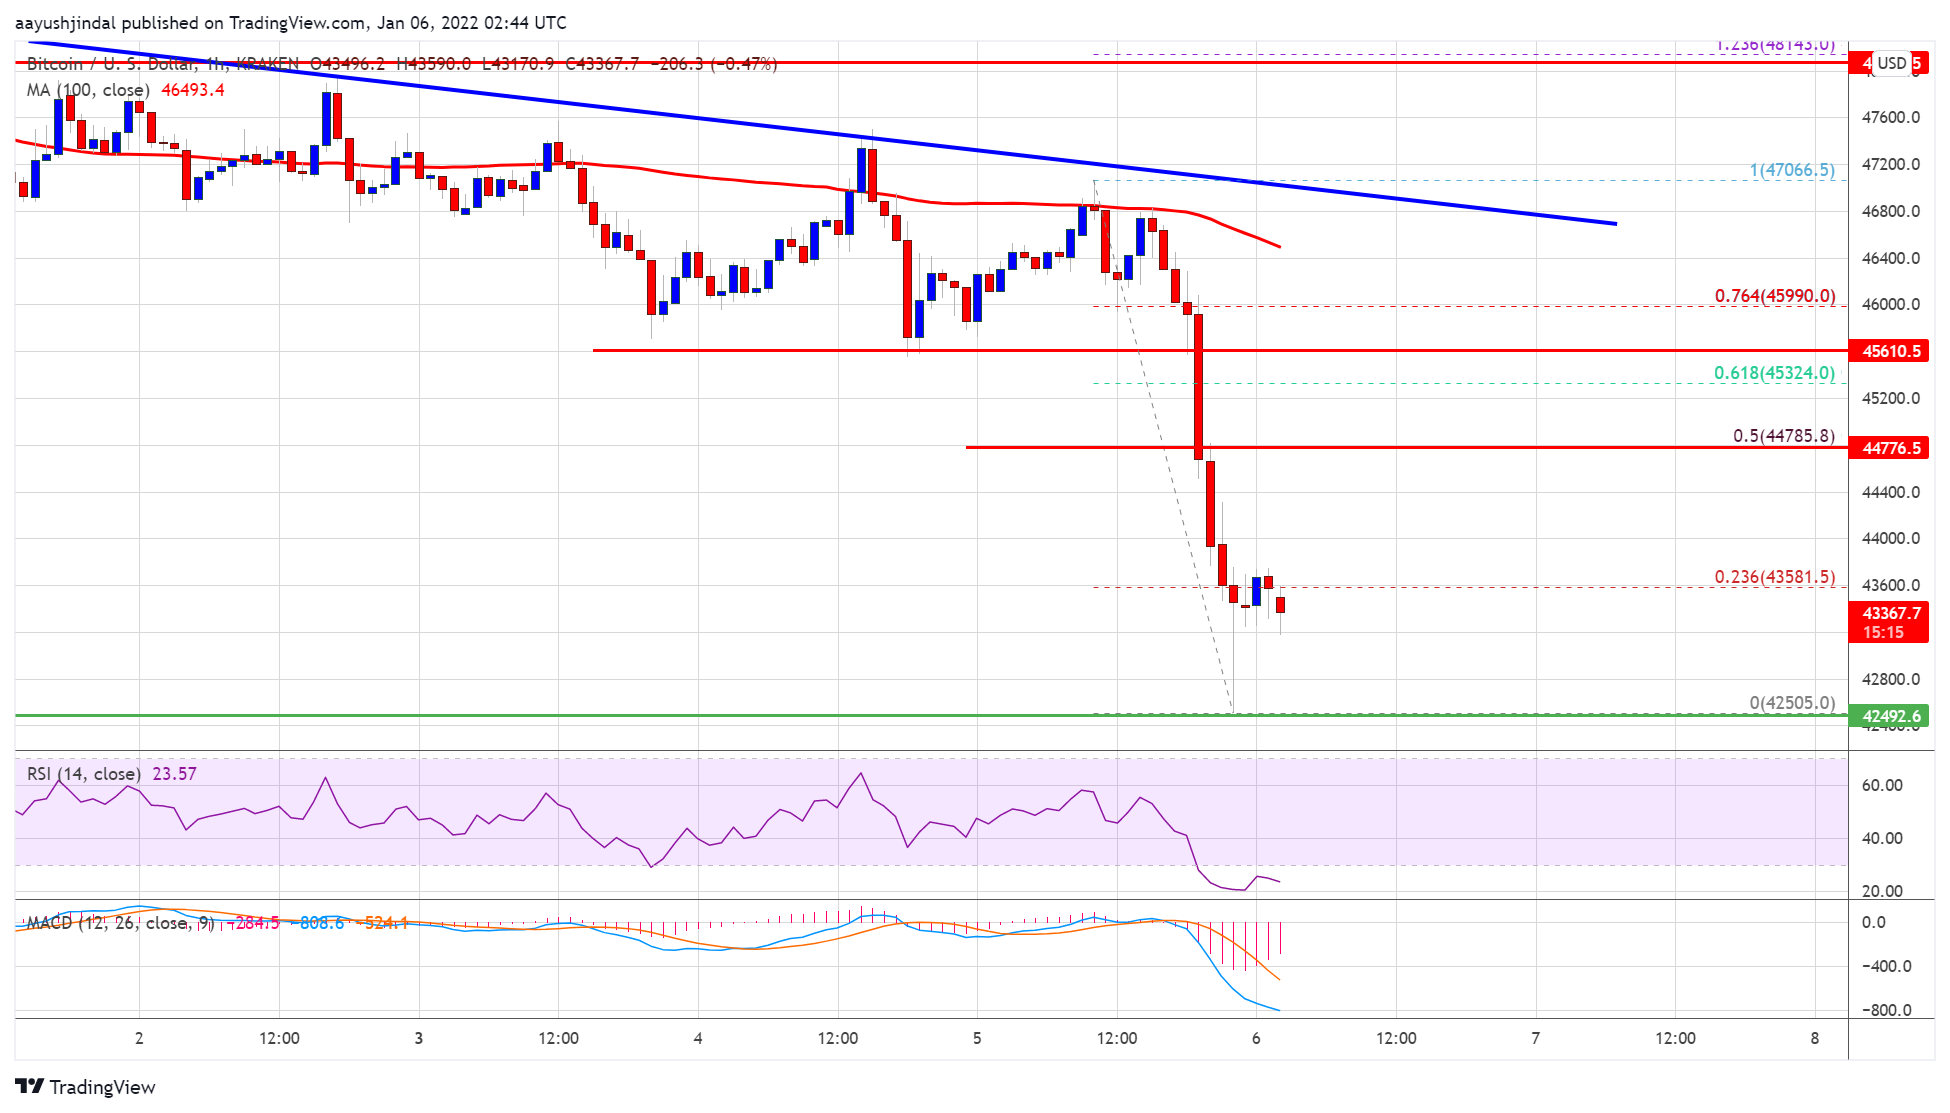
The bears even pushed the price below the $43,500 level. A low is formed near $42,505 and the price is now consolidating losses. It is trading near the $43,500 level. It is facing resistance near the 23.6% Fib retracement level of the key decline from the $47,066 swing high to $42,505 low.
Bitcoin is trading below $45,000 and the 100 hourly simple moving average. An initial resistance is near the $44,000 level. The first major resistance on the upside is near the $44,800 level.
The 50% Fib retracement level of the key decline from the $47,066 swing high to $42,505 low is also near the $44,800 level. Besides, there is a crucial bearish trend line forming with resistance near $46,800 on the hourly chart of the BTC/USD pair.
Source: BTCUSD on TradingView.com
A clear move above the $44,800 resistance zone could send the price towards the trend line. The next major resistance is near the $45,600 pivot zone. A close above $45,600 is needed for a fresh increase in the near term.
More Losses In BTC?
If bitcoin fails to recover above $44,800, it could continue to move down. An immediate support is near the $43,000 zone. The first major support is near $42,500.
A downside break below the $42,500 level could push the price further lower. In the stated case, the price may possibly decline towards the $41,000 level in the coming sessions. The next major support is near the $40,000 level.
Technical indicators:
Hourly MACD – The MACD is now gaining pace in the bearish zone.
Hourly RSI (Relative Strength Index) – The RSI for BTC/USD is well below the 50 level.
Major Support Levels – $43,000, followed by $42,500.
Major Resistance Levels – $44,000, $44,800 and $45,600.
Bitcoin declined sharply below the $45,500 support against the US Dollar. BTC could recover, but upsides might be limited above $45,000.
Bitcoin gained pace below the key $45,500 support zone.
The price is trading below $45,000 and the 100 hourly simple moving average.
There is a crucial bearish trend line forming with resistance near $46,800 on the hourly chart of the BTC/USD pair (data feed from Kraken).
The pair might start recovery, but the bears might remain active near the $45,000 zone.
Bitcoin Price Dives 5%
Bitcoin price failed to clear the $47,500 resistance zone and started a major decline. BTC declined heavily below the $46,000 and $45,00 levels.
The bears even pushed the price below the $43,500 level. A low is formed near $42,505 and the price is now consolidating losses. It is trading near the $43,500 level. It is facing resistance near the 23.6% Fib retracement level of the key decline from the $47,066 swing high to $42,505 low.
Bitcoin is trading below $45,000 and the 100 hourly simple moving average. An initial resistance is near the $44,000 level. The first major resistance on the upside is near the $44,800 level.
The 50% Fib retracement level of the key decline from the $47,066 swing high to $42,505 low is also near the $44,800 level. Besides, there is a crucial bearish trend line forming with resistance near $46,800 on the hourly chart of the BTC/USD pair.
Source: BTCUSD on TradingView.com
A clear move above the $44,800 resistance zone could send the price towards the trend line. The next major resistance is near the $45,600 pivot zone. A close above $45,600 is needed for a fresh increase in the near term.
More Losses In BTC?
If bitcoin fails to recover above $44,800, it could continue to move down. An immediate support is near the $43,000 zone. The first major support is near $42,500.
A downside break below the $42,500 level could push the price further lower. In the stated case, the price may possibly decline towards the $41,000 level in the coming sessions. The next major support is near the $40,000 level.
Technical indicators:
Hourly MACD – The MACD is now gaining pace in the bearish zone.
Hourly RSI (Relative Strength Index) – The RSI for BTC/USD is well below the 50 level.
Major Support Levels – $43,000, followed by $42,500.
Major Resistance Levels – $44,000, $44,800 and $45,600.
Tags: bitcoinbtcusdBTCUSDTxbtusd
FeedzyRead More


Recent Posts
Bitcoin At Critical Juncture – Price Levels To Watch: Analyst
Bitcoin maintains its bullish form from April as it gains by over 4% in the…
Analyst Says Bitcoin’s Most Crucial Support Level Is At $91,200 — What’s Next?
The price of Bitcoin has started the month of May with a similar bullish impetus…
Bitcoin Price Trading Within Dense Supply Cluster — What Lies Beyond $100K?
After two weeks of strong action, the Bitcoin price seems to be back on the…
Bitcoin To Infinity? Venture Capitalist Says Crypto’s Value Vs. Dollar Has No Ceiling
The dollar is weakening this year. As reported, the US dollar index declined 7% year-to-date,…
Arizona Governor Calls Crypto an ‘Untested Investment,’ Vetoes Bitcoin Reserve Bill
Arizona will not be investing in bitcoin (BTC), at least not this year. Governor Katie…
Best Altcoins to Buy as Institutional Bitcoin Buying Set to Outpace Retail
Bitcoin has emerged as the market’s top hedge option against rising geopolitical uncertainty and cross-border…