TA: Bitcoin Price At Major Risk of A Breakdown Below $20K: Here’s Why
Bitcoin settled below the $21,000 support zone against the US Dollar. BTC is showing bearish signs and remains at a risk of a major breakdown below $20,000.
Bitcoin struggled to correct higher and stayed below the $21,000 resistance zone.
The price is now trading below $20,750 and the 100 hourly simple moving average.
There is a key bearish trend line forming with resistance near $20,250 on the hourly chart of the BTC/USD pair (data feed from Kraken).
The pair is consolidating above the $20,000 level and might start another decline.
Bitcoin Price Faces Sellers
Bitcoin price remained in a bearish zone below the $21,000 level. There was a short-term recovery wave, but the bears were active near the $20,300 and $20,350 levels.
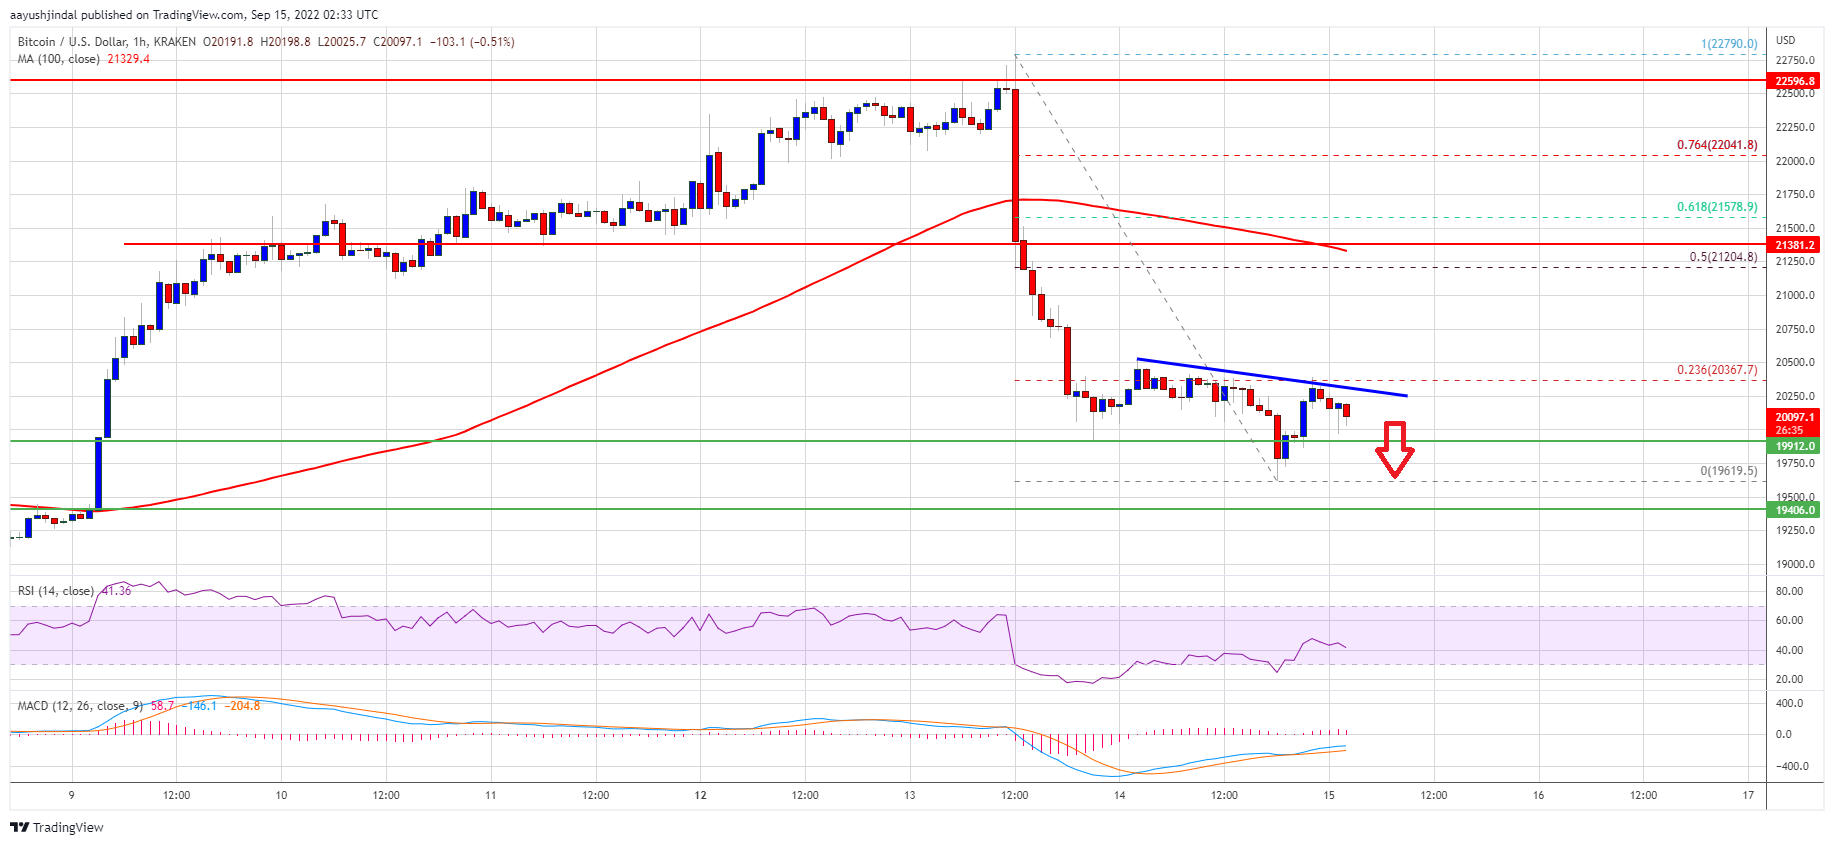
The price started a fresh decline and traded below the $20,000 level. It even broke the recent swing low and traded to a new weekly low at $19,619. The price is now trading below $20,750 and the 100 hourly simple moving average.
There is also a key bearish trend line forming with resistance near $20,250 on the hourly chart of the BTC/USD pair. On the upside, an immediate resistance is near the $20,300 level. It is near the 23.6% Fib retracement level of the key drop from the $22,790 swing high to $19,619 low.
A clear move above the trend line and $20,300 might send the price towards the $20,750 resistance. The next major resistance sits near the $21,200 level. It coincides with the 50% Fib retracement level of the key drop from the $22,790 swing high to $19,619 low.
Source: BTCUSD on TradingView.com
A close above the $21,200 resistance might start a fresh increase. In the stated case, the price may perhaps rise towards $22,000. Any more gains might send the price towards the $22,450 resistance zone.
More Losses in BTC?
If bitcoin fails to clear the $20,300 resistance zone, it could continue to move down. An immediate support on the downside is near the $20,000 zone.
The next major support is near the $19,600 and $19,500 levels. A downside break below the $19,500 level might send the price towards the $18,500 support.
Technical indicators:
Hourly MACD – The MACD is now gaining pace in the bearish zone.
Hourly RSI (Relative Strength Index) – The RSI for BTC/USD is now below the 50 level.
Major Support Levels – $20,000, followed by $19,500.
Major Resistance Levels – $20,300, $20,750 and $21,200.
Bitcoin settled below the $21,000 support zone against the US Dollar. BTC is showing bearish signs and remains at a risk of a major breakdown below $20,000.
Bitcoin struggled to correct higher and stayed below the $21,000 resistance zone.
The price is now trading below $20,750 and the 100 hourly simple moving average.
There is a key bearish trend line forming with resistance near $20,250 on the hourly chart of the BTC/USD pair (data feed from Kraken).
The pair is consolidating above the $20,000 level and might start another decline.
Bitcoin Price Faces Sellers
Bitcoin price remained in a bearish zone below the $21,000 level. There was a short-term recovery wave, but the bears were active near the $20,300 and $20,350 levels.
The price started a fresh decline and traded below the $20,000 level. It even broke the recent swing low and traded to a new weekly low at $19,619. The price is now trading below $20,750 and the 100 hourly simple moving average.
There is also a key bearish trend line forming with resistance near $20,250 on the hourly chart of the BTC/USD pair. On the upside, an immediate resistance is near the $20,300 level. It is near the 23.6% Fib retracement level of the key drop from the $22,790 swing high to $19,619 low.
A clear move above the trend line and $20,300 might send the price towards the $20,750 resistance. The next major resistance sits near the $21,200 level. It coincides with the 50% Fib retracement level of the key drop from the $22,790 swing high to $19,619 low.
Source: BTCUSD on TradingView.com
A close above the $21,200 resistance might start a fresh increase. In the stated case, the price may perhaps rise towards $22,000. Any more gains might send the price towards the $22,450 resistance zone.
More Losses in BTC?
If bitcoin fails to clear the $20,300 resistance zone, it could continue to move down. An immediate support on the downside is near the $20,000 zone.
The next major support is near the $19,600 and $19,500 levels. A downside break below the $19,500 level might send the price towards the $18,500 support.
Technical indicators:
Hourly MACD – The MACD is now gaining pace in the bearish zone.
Hourly RSI (Relative Strength Index) – The RSI for BTC/USD is now below the 50 level.
Major Support Levels – $20,000, followed by $19,500.
Major Resistance Levels – $20,300, $20,750 and $21,200.
Tags: bitcoinbtcusdBTCUSDTxbtusd
NewsBTCRead More


Recent Posts
Corporate Bitcoin Holdings Hit Record High in Q1 2025 as Public Companies Accelerate Accumulation
Bitcoin Magazine Corporate Bitcoin Holdings Hit Record High in Q1 2025 as Public Companies Accelerate…
Crypto for Advisors: Generating Yield With Bitcoin
In today’s crypto for advisors, Todd Bendell from Amphibian Capital breaks down bitcoin yield products…
Binance Advising Multiple Governments On Strategic Bitcoin Reserve
Bitcoin Magazine Binance Advising Multiple Governments On Strategic Bitcoin Reserve Financial Times reports that bitcoin…
CoinDesk 20 Performance Update: Bitcoin Cash (BCH) Gains 4.2%, Leading Index Higher
CoinDesk Indices presents its daily market update, highlighting the performance of leaders and laggards in…
Degrossing Now, Bitcoin Moonshot Next? Here’s The Case, Says Analyst
Bitcoin may be trapped beneath the gravitational pull of forced deleveraging, but macro strategist and…
Lombard Finance Launches Toolkit to Unlock Bitcoin’s $154B DeFi Opportunity
Lombard Finance, a Bitcoin infrastructure developer, has launched a software development kit (SDK) that allows…