Bitcoin started an upside correction from the $18,223 low against the US Dollar. BTC climbed above $19,000, but it is now facing resistance near the 100 hourly SMA.
Bitcoin traded as low as $18,223 before it started an upside correction.
The price is still trading below $20,000 and the 100 hourly simple moving average.
There is a key bearish trend line forming with resistance near $19,650 on the hourly chart of the BTC/USD pair (data feed from Kraken).
The pair must clear the trend line and the 100 hourly SMA to continue higher towards $20,500.
Bitcoin Price Recovers Above $19,000
Bitcoin price extended losses after it settled below the $19,000 level. BTC broke the $18,500 support zone and traded as low as $18,223.
There was no test of the $18,000 zone and the price started an upside correction. There was a steady increase above the $18,500 and $18,800 levels. The price was able to clear the 50% Fib retracement level of the downward move from the $20,198 swing high to $18,223 low.
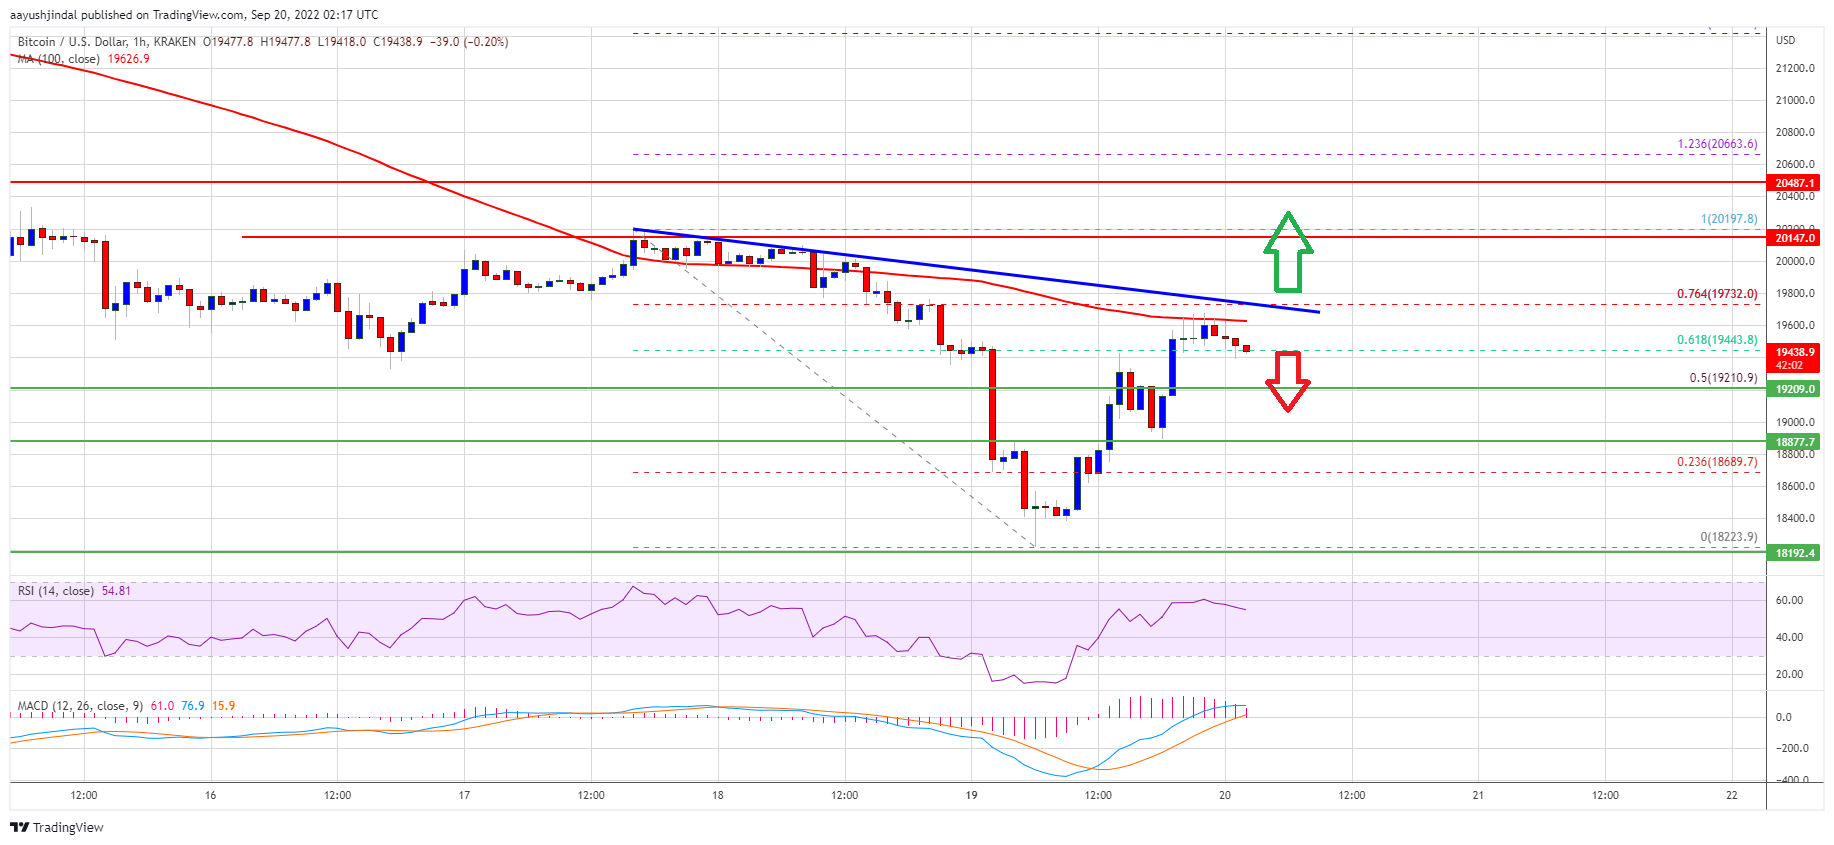
Bitcoin price even spiked above the $19,500 resistance zone. However, the bears were active near the $19,600 level and the 100 hourly simple moving average.
There is also a key bearish trend line forming with resistance near $19,650 on the hourly chart of the BTC/USD pair. The trend line is near the 76.4% Fib retracement level of the downward move from the $20,198 swing high to $18,223 low.
Source: BTCUSD on TradingView.com
On the upside, an immediate resistance is near the $19,600 level and the trend line. The next major resistance sits near the $20,000 level. Any more gains might send the price towards the $20,500 resistance zone. Furthermore, if the bulls remain in action, the price could test $21,200.
Fresh Decline in BTC?
If bitcoin fails to continue higher above the $19,600 resistance zone, it could start a fresh decline. An immediate support on the downside is near the $19,200 zone.
The next major support is near the $18,850 level. A clear move below the $18,850 and $18,800 levels might open the doors for a move towards the $18,223 low or even to a new low.
Technical indicators:
Hourly MACD – The MACD is now losing pace in the bullish zone.
Hourly RSI (Relative Strength Index) – The RSI for BTC/USD is now above the 50 level.
Major Support Levels – $19,200, followed by $18,850.
Major Resistance Levels – $19,600, $19,650 and $20,500.
Bitcoin started an upside correction from the $18,223 low against the US Dollar. BTC climbed above $19,000, but it is now facing resistance near the 100 hourly SMA.
Bitcoin traded as low as $18,223 before it started an upside correction.
The price is still trading below $20,000 and the 100 hourly simple moving average.
There is a key bearish trend line forming with resistance near $19,650 on the hourly chart of the BTC/USD pair (data feed from Kraken).
The pair must clear the trend line and the 100 hourly SMA to continue higher towards $20,500.
Bitcoin price extended losses after it settled below the $19,000 level. BTC broke the $18,500 support zone and traded as low as $18,223.
There was no test of the $18,000 zone and the price started an upside correction. There was a steady increase above the $18,500 and $18,800 levels. The price was able to clear the 50% Fib retracement level of the downward move from the $20,198 swing high to $18,223 low.
Bitcoin price even spiked above the $19,500 resistance zone. However, the bears were active near the $19,600 level and the 100 hourly simple moving average.
There is also a key bearish trend line forming with resistance near $19,650 on the hourly chart of the BTC/USD pair. The trend line is near the 76.4% Fib retracement level of the downward move from the $20,198 swing high to $18,223 low.
Source: BTCUSD on TradingView.com
On the upside, an immediate resistance is near the $19,600 level and the trend line. The next major resistance sits near the $20,000 level. Any more gains might send the price towards the $20,500 resistance zone. Furthermore, if the bulls remain in action, the price could test $21,200.
If bitcoin fails to continue higher above the $19,600 resistance zone, it could start a fresh decline. An immediate support on the downside is near the $19,200 zone.
The next major support is near the $18,850 level. A clear move below the $18,850 and $18,800 levels might open the doors for a move towards the $18,223 low or even to a new low.
Technical indicators:
Hourly MACD – The MACD is now losing pace in the bullish zone.
Hourly RSI (Relative Strength Index) – The RSI for BTC/USD is now above the 50 level.
Major Support Levels – $19,200, followed by $18,850.
Major Resistance Levels – $19,600, $19,650 and $20,500.
Tags: bitcoinbtcusdBTCUSDTxbtusd
NewsBTCRead More
The price of Bitcoin (BTC) has shown only sideways movement in the last day resulting…
A sluggish Bitcoin price performance has not been the only disappointing theme for the largest…
World Liberty Financial, Trump’s crypto company, is making moves again. It recently bought another $1.4M…
Disclaimer: The analyst who wrote this piece owns shares of Strategy (MSTR) Strategy (MSTR) could…
Peter Brandt, a seasoned trader, has dismissed optimistic predictions in the wake of Bitcoin’s recent…
This article is part of a four-piece series on El Salvador. You can find the…