Bitcoin broke the key $19,500 support against the US Dollar. BTC is showing bearish signs and remains at a risk of a move towards the $18,000 level.
Bitcoin failed to start a fresh increase and declined below the $19,500 support.
The price is now trading below the $19,000 level and the 100 hourly simple moving average.
There is a connecting bearish trend line forming with resistance near $19,420 on the hourly chart of the BTC/USD pair (data feed from Kraken).
The pair could correct higher, but upsides might be limited above $19,500.
Bitcoin Price Takes A Hit
Bitcoin price failed to gain pace for a move above the $20,500 and $20,550 resistance levels. There were many failed attempts, sparking a downside reaction below the key $19,500 support zone.
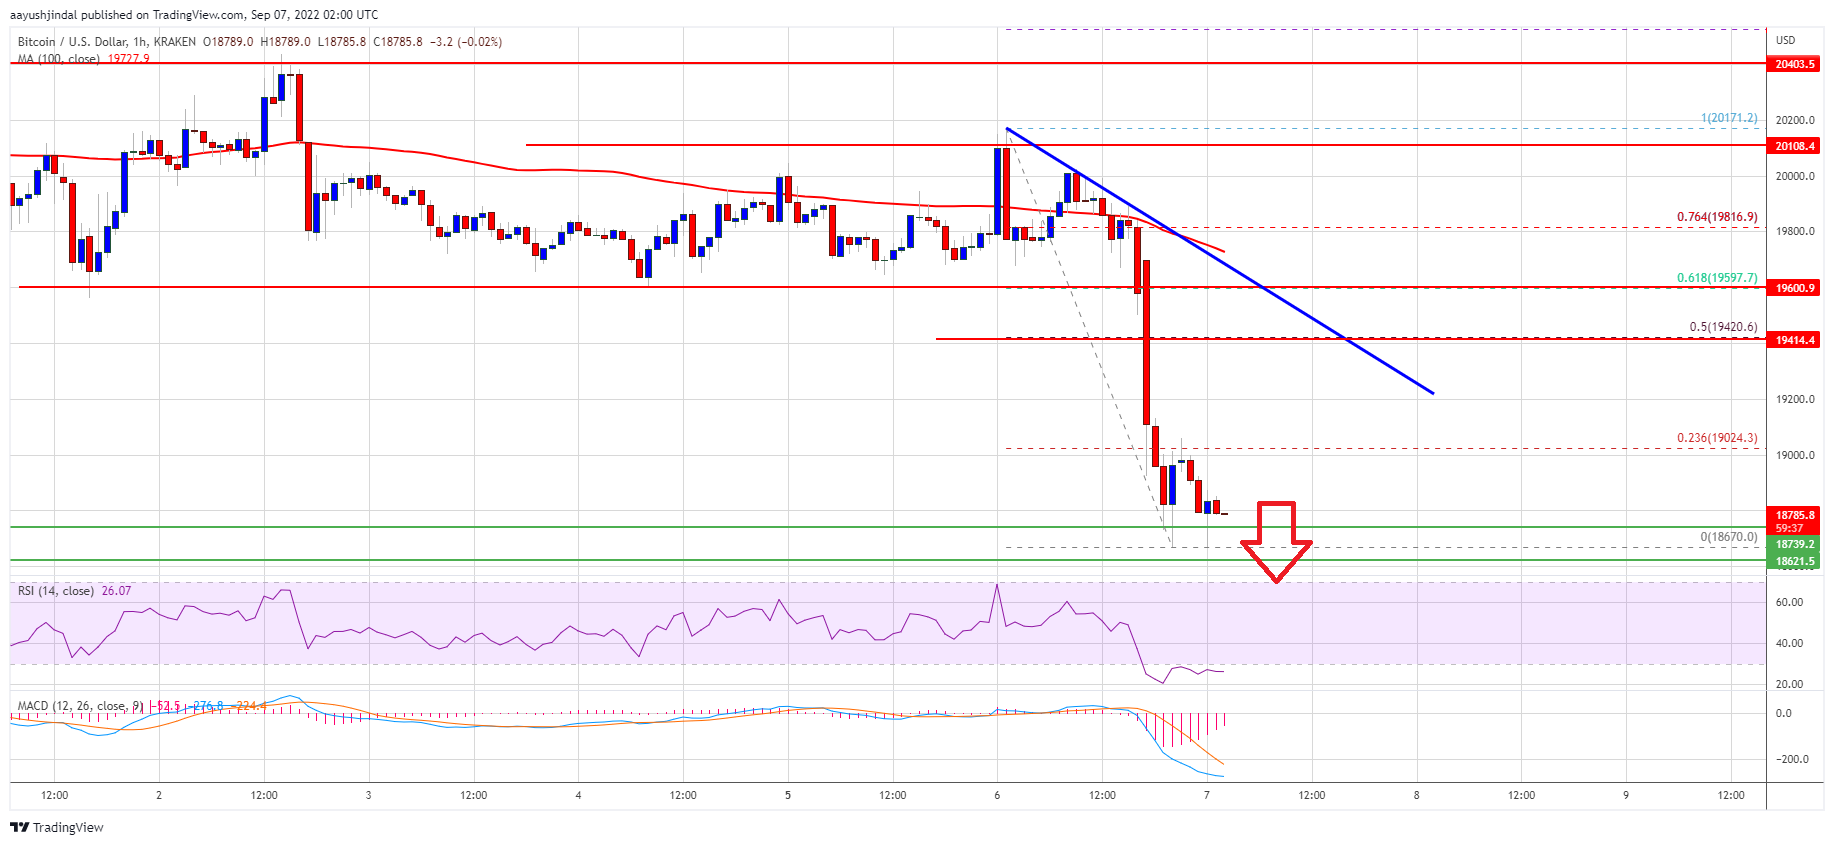
There was a sharp decline below the $19,500 support and the 100 hourly simple moving average. The price declined below the $19,200 and $19,000 levels. A low is formed near $18,670 and the price is now consolidating losses.
It is now trading below the $19,000 level and the 100 hourly simple moving average. On the upside, an immediate resistance is near the $19,000 level. It is near the 23.6% Fib retracement level of the recent decline from the $20,171 swing high to $18,670 low.
The next major resistance sits near the $19,400 level. There is also a connecting bearish trend line forming with resistance near $19,420 on the hourly chart of the BTC/USD pair.
Source: BTCUSD on TradingView.com
The trend line is near the 50% Fib retracement level of the recent decline from the $20,171 swing high to $18,670 low. Any more gains might send the price towards the $19,800 resistance zone and the 100 hourly simple moving average.
More Losses in BTC?
If bitcoin fails to start a recovery wave above the $19,000 zone, it could continue to move down. An immediate support on the downside is near the $18,650 zone.
The next major support sits near the $18,500 level. A downside break below the $18,500 support might spark more downsides. In the stated case, the price may perhaps test the $18,000 support.
Technical indicators:
Hourly MACD – The MACD is now gaining pace in the bearish zone.
Hourly RSI (Relative Strength Index) – The RSI for BTC/USD is now below the 50 level.
Major Support Levels – $18,650, followed by $18,500.
Major Resistance Levels – $19,000, $19,400 and $19,500.
Bitcoin broke the key $19,500 support against the US Dollar. BTC is showing bearish signs and remains at a risk of a move towards the $18,000 level.
Bitcoin failed to start a fresh increase and declined below the $19,500 support.
The price is now trading below the $19,000 level and the 100 hourly simple moving average.
There is a connecting bearish trend line forming with resistance near $19,420 on the hourly chart of the BTC/USD pair (data feed from Kraken).
The pair could correct higher, but upsides might be limited above $19,500.
Bitcoin price failed to gain pace for a move above the $20,500 and $20,550 resistance levels. There were many failed attempts, sparking a downside reaction below the key $19,500 support zone.
There was a sharp decline below the $19,500 support and the 100 hourly simple moving average. The price declined below the $19,200 and $19,000 levels. A low is formed near $18,670 and the price is now consolidating losses.
It is now trading below the $19,000 level and the 100 hourly simple moving average. On the upside, an immediate resistance is near the $19,000 level. It is near the 23.6% Fib retracement level of the recent decline from the $20,171 swing high to $18,670 low.
The next major resistance sits near the $19,400 level. There is also a connecting bearish trend line forming with resistance near $19,420 on the hourly chart of the BTC/USD pair.
Source: BTCUSD on TradingView.com
The trend line is near the 50% Fib retracement level of the recent decline from the $20,171 swing high to $18,670 low. Any more gains might send the price towards the $19,800 resistance zone and the 100 hourly simple moving average.
If bitcoin fails to start a recovery wave above the $19,000 zone, it could continue to move down. An immediate support on the downside is near the $18,650 zone.
The next major support sits near the $18,500 level. A downside break below the $18,500 support might spark more downsides. In the stated case, the price may perhaps test the $18,000 support.
Technical indicators:
Hourly MACD – The MACD is now gaining pace in the bearish zone.
Hourly RSI (Relative Strength Index) – The RSI for BTC/USD is now below the 50 level.
Major Support Levels – $18,650, followed by $18,500.
Major Resistance Levels – $19,000, $19,400 and $19,500.
Tags: bitcoinbtcusdBTCUSDTxbtusd
NewsBTCRead More
A former cryptocurrency exchange executive remarked that Bitcoin is an inescapable reality, a statement that…
According to an X post by crypto analyst Ali Martinez, Bitcoin (BTC) is witnessing a…
Following a lackluster performance in recent weeks, Bitcoin appears to be seeing a steady recovery…
Brian Armstrong, the CEO of Coinbase, has recently made an audacious statement regarding Bitcoin that…
The U.S. Marshals Service (USMS) is tasked with managing assets seized by law enforcement in…
Bitcoin has soared past the $98,000 on Thursday, fueling intense debate among traders over whether…