TA: Bitcoin Price Breaks $24K, Why BTC Could Rise Further To $25K
Bitcoin gained pace and cleared the $24,000 resistance against the US Dollar. BTC could rise further towards $25,000 if it stays above the $23,000 support.
Bitcoin remained in a positive zone and climbed above the $24,000 resistance zone.
The price is now trading above the $23,000 level and testing the 100 hourly simple moving average.
There is a key bullish trend line forming with support near $23,200 on the hourly chart of the BTC/USD pair (data feed from Kraken).
The pair might continue to rise if it clears the $23,750 and $24,000 levels.
Bitcoin Price Remains In Uptrend
Bitcoin price started a steady increase after it cleared the $23,000 resistance zone. BTC gained pace for a move above the $23,500 resistance level.
The price even broke the $23,750 level and settled above the 100 hourly simple moving average. Finally, it spiked above the $24,000 level. A high was formed near $24,264 and the price is now consolidating gains. There was a minor downside correction below the $23,750 level.
Bitcoin traded below the 38.2% Fib retracement level of the upward move from the $21,405 swing low to $24,264 high. However, the bulls were active near the $23,000 support zone.
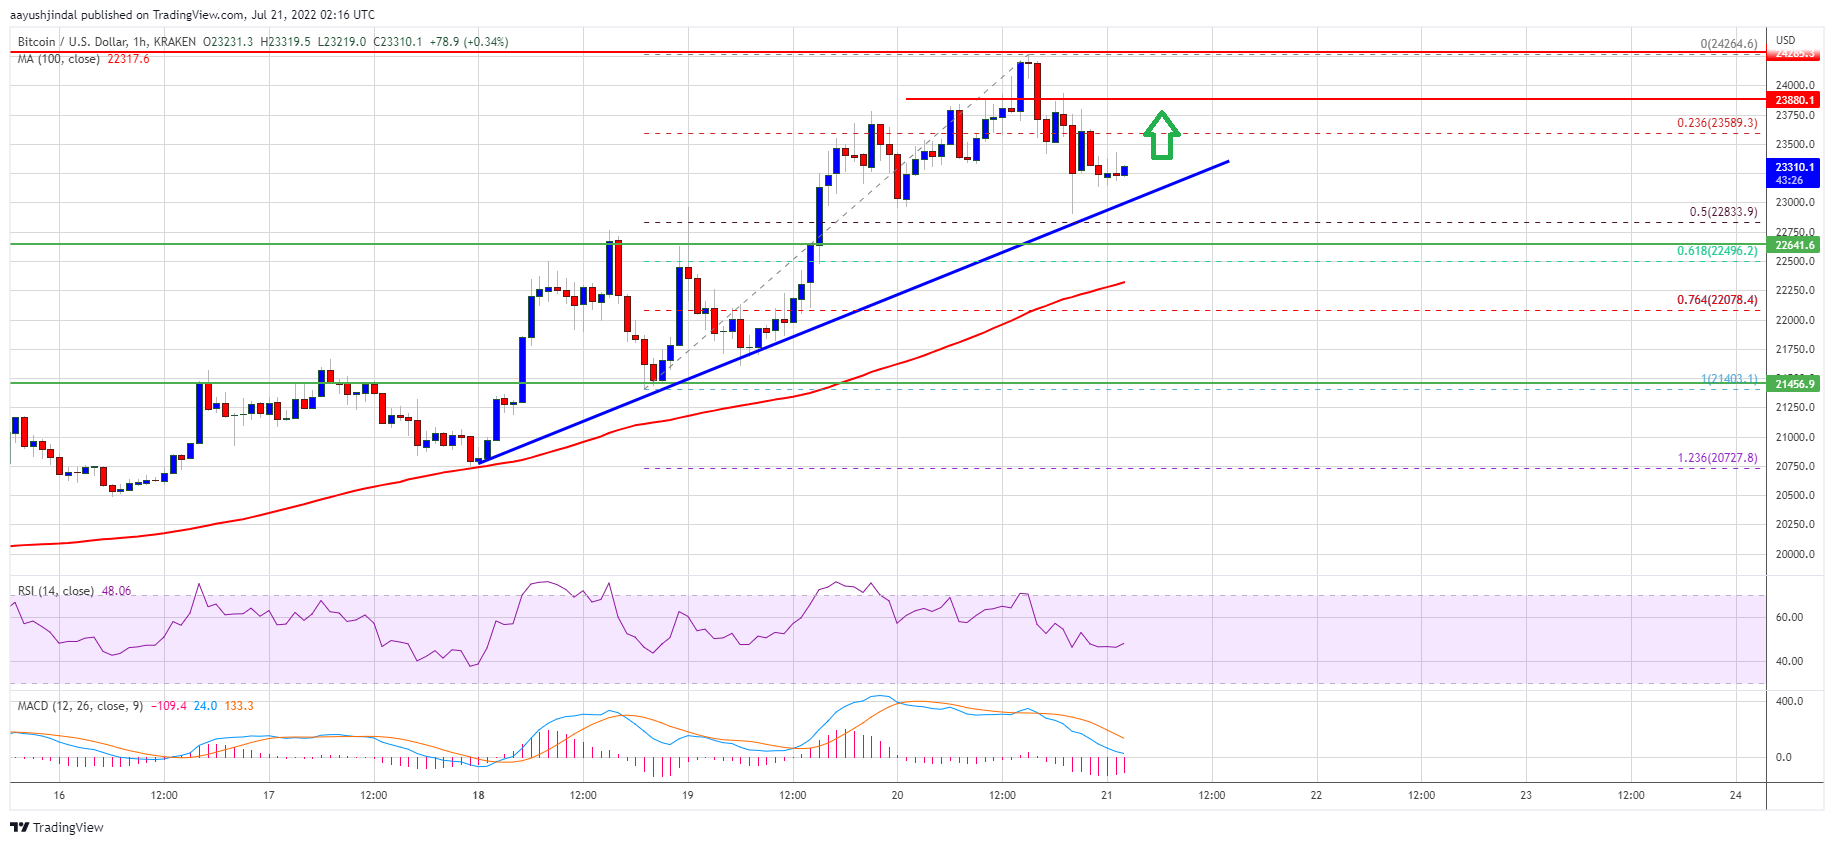
There is also a key bullish trend line forming with support near $23,200 on the hourly chart of the BTC/USD pair. On the upside, bitcoin price could face resistance near the $23,750 level. The next key resistance is near the $24,000 zone.
Source: BTCUSD on TradingView.com
A close above the $24,000 resistance zone could set the pace for more gains. In the stated case, the price may perhaps rise towards the $24,500 level. The next major resistance sits near the $25,000 level.
Dips Supported in BTC?
If bitcoin fails to clear the $23,750 resistance zone, it could start a downside correction. An immediate support on the downside is near the $23,200 level.
The next major support now sits near the $23,000 level and the trend line zone. It is also close to the 50% Fib retracement level of the upward move from the $21,405 swing low to $24,264 high. A clear move below the trend line support might send the price towards $22,250 and the 100 hourly SMA.
Technical indicators:
Hourly MACD – The MACD is now losing pace in the bullish zone.
Hourly RSI (Relative Strength Index) – The RSI for BTC/USD is now above the 50 level.
Major Support Levels – $23,000, followed by $22,750.
Major Resistance Levels – $23,750, $24,000 and $25,000.
Bitcoin gained pace and cleared the $24,000 resistance against the US Dollar. BTC could rise further towards $25,000 if it stays above the $23,000 support.
Bitcoin remained in a positive zone and climbed above the $24,000 resistance zone.
The price is now trading above the $23,000 level and testing the 100 hourly simple moving average.
There is a key bullish trend line forming with support near $23,200 on the hourly chart of the BTC/USD pair (data feed from Kraken).
The pair might continue to rise if it clears the $23,750 and $24,000 levels.
Bitcoin Price Remains In Uptrend
Bitcoin price started a steady increase after it cleared the $23,000 resistance zone. BTC gained pace for a move above the $23,500 resistance level.
The price even broke the $23,750 level and settled above the 100 hourly simple moving average. Finally, it spiked above the $24,000 level. A high was formed near $24,264 and the price is now consolidating gains. There was a minor downside correction below the $23,750 level.
Bitcoin traded below the 38.2% Fib retracement level of the upward move from the $21,405 swing low to $24,264 high. However, the bulls were active near the $23,000 support zone.
There is also a key bullish trend line forming with support near $23,200 on the hourly chart of the BTC/USD pair. On the upside, bitcoin price could face resistance near the $23,750 level. The next key resistance is near the $24,000 zone.
Source: BTCUSD on TradingView.com
A close above the $24,000 resistance zone could set the pace for more gains. In the stated case, the price may perhaps rise towards the $24,500 level. The next major resistance sits near the $25,000 level.
Dips Supported in BTC?
If bitcoin fails to clear the $23,750 resistance zone, it could start a downside correction. An immediate support on the downside is near the $23,200 level.
The next major support now sits near the $23,000 level and the trend line zone. It is also close to the 50% Fib retracement level of the upward move from the $21,405 swing low to $24,264 high. A clear move below the trend line support might send the price towards $22,250 and the 100 hourly SMA.
Technical indicators:
Hourly MACD – The MACD is now losing pace in the bullish zone.
Hourly RSI (Relative Strength Index) – The RSI for BTC/USD is now above the 50 level.
Major Support Levels – $23,000, followed by $22,750.
Major Resistance Levels – $23,750, $24,000 and $25,000.
Tags: bitcoinbtcusdBTCUSDTxbtusd
FeedzyRead More


Recent Posts
Dogecoin Surges 10%, Bitcoin Nears $104K Amid Renewed ‘Risk-on’ Sentiment
Bitcoin pushed past the six-figure mark for the first time in over two months, coming…
Bitcoin Price Above $100,000: CryptoQuant CEO Says It’s Time To Throw Out ‘Cycle Theory’
CryptoQuant Founder and CEO Ki Young Ju has walked back his bearish prediction after the…
Bull Market Reignited? Analyst Says Bitcoin Rally Mirrors June 2020 Setup
Bitcoin’s recent surge has kept its price firmly above the $100,000 price level, reflecting ongoing…
Bitcoin Market Cycle Indicator Hints At Bullish Breakout Ahead, Analyst Says
According to a recent CryptoQuant Quicktake post by contributor burakkemeci, Bitcoin (BTC) is beginning to…
Bitcoin Reaches $103K as Funding Rate Turns Positive Post-Liquidations
Bitcoin has revisited the $100,000 mark for the first time in months, gaining nearly 5%…
New Bitcoin Whales Sitting On 185% Higher Cost Basis Than HODLer Whales, Data Shows
On-chain data shows the Bitcoin short-term holder whales have recently been entering at three times…