Bitcoin started a downside correction from $44,500 against the US Dollar. BTC is stable above $42,800 and the bulls might aim a fresh increase above $43,500.
Bitcoin is trading in a positive zone above $42,500 and $42,800.
The price is trading below $43,500 and the 100 hourly simple moving average.
There is a key contracting triangle forming with resistance near $43,200 on the hourly chart of the BTC/USD pair (data feed from Kraken).
The pair could start a major increase if there is a clear move above the $43,500 resistance.
Bitcoin Price Is Holding Support
Bitcoin price extended increase above the $44,000 resistance zone. BTC even spiked above the $44,200 level before it faced sellers.
A high was formed near $44,400 and the price started a fresh decline. There was a clear move below the $43,500 and $43,200 levels. The price even dived below the $42,500 support and a close below the 100 hourly simple moving average.
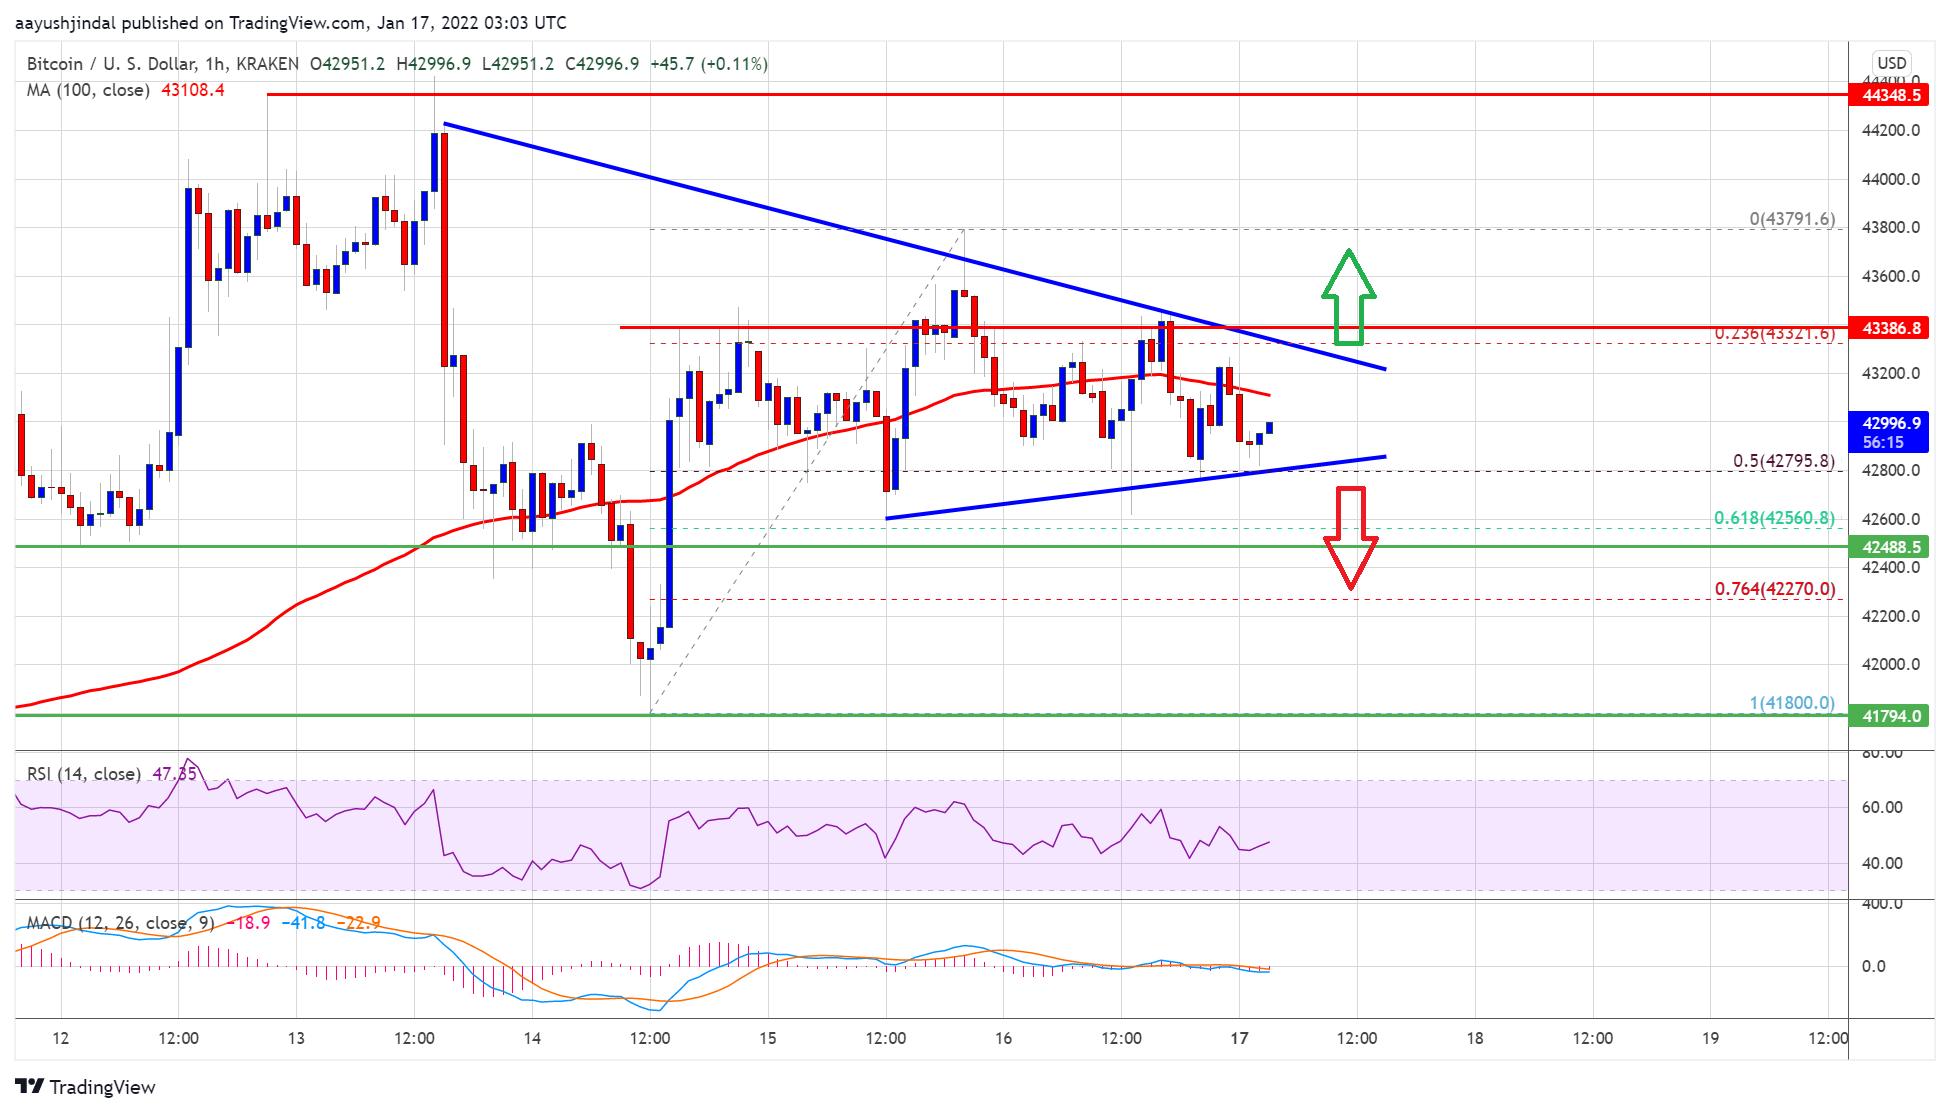
A low was formed near $41,800 before the price started an upside correction. It traded as high as $43,791 and is currently consolidating. Bitcoin price is trading below $43,500 and the 100 hourly simple moving average.
An immediate support is near the 50% Fib retracement level of the recent increase from the $41,800 swing low to $43,791 high. Besides, there is a key contracting triangle forming with resistance near $43,200 on the hourly chart of the BTC/USD pair.
Source: BTCUSD on TradingView.com
On the upside, an initial resistance is near the $43,200 level. The next major resistance is near the $43,500 level. A clear move above the $43,500 level might send the price towards the $44,000 resistance. Any more gains may perhaps call for a test of the $44,200 resistance zone. The next major resistance is near the $45,000 level.
Fresh Decline in BTC?
If bitcoin fails to start a fresh increase above $43,500, it could start a fresh decline. An immediate support on the downside is near the $42,800 zone.
The first major support is seen near the $42,500 zone. It is near the 61.8% Fib retracement level of the recent increase from the $41,800 swing low to $43,791 high. A downside break below the $42,500 support zone could lead the price towards the $41,800 level.
Technical indicators:
Hourly MACD – The MACD is slowly losing pace in the bearish zone.
Hourly RSI (Relative Strength Index) – The RSI for BTC/USD is near the 50 level.
Major Support Levels – $42,800, followed by $42,500.
Major Resistance Levels – $43,200, $43,500 and $44,200.
Bitcoin started a downside correction from $44,500 against the US Dollar. BTC is stable above $42,800 and the bulls might aim a fresh increase above $43,500.
Bitcoin is trading in a positive zone above $42,500 and $42,800.
The price is trading below $43,500 and the 100 hourly simple moving average.
There is a key contracting triangle forming with resistance near $43,200 on the hourly chart of the BTC/USD pair (data feed from Kraken).
The pair could start a major increase if there is a clear move above the $43,500 resistance.
Bitcoin price extended increase above the $44,000 resistance zone. BTC even spiked above the $44,200 level before it faced sellers.
A high was formed near $44,400 and the price started a fresh decline. There was a clear move below the $43,500 and $43,200 levels. The price even dived below the $42,500 support and a close below the 100 hourly simple moving average.
A low was formed near $41,800 before the price started an upside correction. It traded as high as $43,791 and is currently consolidating. Bitcoin price is trading below $43,500 and the 100 hourly simple moving average.
An immediate support is near the 50% Fib retracement level of the recent increase from the $41,800 swing low to $43,791 high. Besides, there is a key contracting triangle forming with resistance near $43,200 on the hourly chart of the BTC/USD pair.
Source: BTCUSD on TradingView.com
On the upside, an initial resistance is near the $43,200 level. The next major resistance is near the $43,500 level. A clear move above the $43,500 level might send the price towards the $44,000 resistance. Any more gains may perhaps call for a test of the $44,200 resistance zone. The next major resistance is near the $45,000 level.
If bitcoin fails to start a fresh increase above $43,500, it could start a fresh decline. An immediate support on the downside is near the $42,800 zone.
The first major support is seen near the $42,500 zone. It is near the 61.8% Fib retracement level of the recent increase from the $41,800 swing low to $43,791 high. A downside break below the $42,500 support zone could lead the price towards the $41,800 level.
Technical indicators:
Hourly MACD – The MACD is slowly losing pace in the bearish zone.
Hourly RSI (Relative Strength Index) – The RSI for BTC/USD is near the 50 level.
Major Support Levels – $42,800, followed by $42,500.
Major Resistance Levels – $43,200, $43,500 and $44,200.
Tags: bitcoinbtcusdBTCUSDTxbtusd
FeedzyRead More
Bitcoin price started a fresh increase above the $82,500 zone. BTC is now consolidating gains…
The Bitcoin price action this weekend has been quite bubbly and impressive, with the premier…
Bitcoin (BTC) proponent Michael Saylor has hinted the company he co-founded, Strategy (MSTR), may be…
The price of Bitcoin has found its way back above the $85,000 mark, marking a…
Bitcoin has broken out of a technical formation that may place it on track toward…
Prominent X market analyst Cryptododo7 has shared a bearish prediction on the Bitcoin market amidst…