Bitcoin extended losses below the $21,000 support against the US Dollar. BTC is consolidating and any upsides might face hurdles near $21,500.
Bitcoin remained in a bearish zone and traded below the $21,000 level.
The price is now trading below the $21,500 level and the 100 hourly simple moving average.
There is a key bearish trend line forming with resistance near $21,650 on the hourly chart of the BTC/USD pair (data feed from Kraken).
The pair might correct higher but upsides might be limited above $21,500.
Bitcoin Price Remains In A Bearish Zone
Bitcoin price remained in a bearish zone after it settled below the $22,000 support zone. It consolidated near the $21,000 zone for some time before there were more losses.
The price declined below the $21,000 level but downsides were limited. A low is formed near $20,750 and the price is now consolidating losses. It is now trading below the $21,500 level and the 100 hourly simple moving average.
There was a minor upside above the $21,000 level. The price cleared the 23.6% Fib retracement level of the recent drop from the $22,250 swing high to $20,750 low.
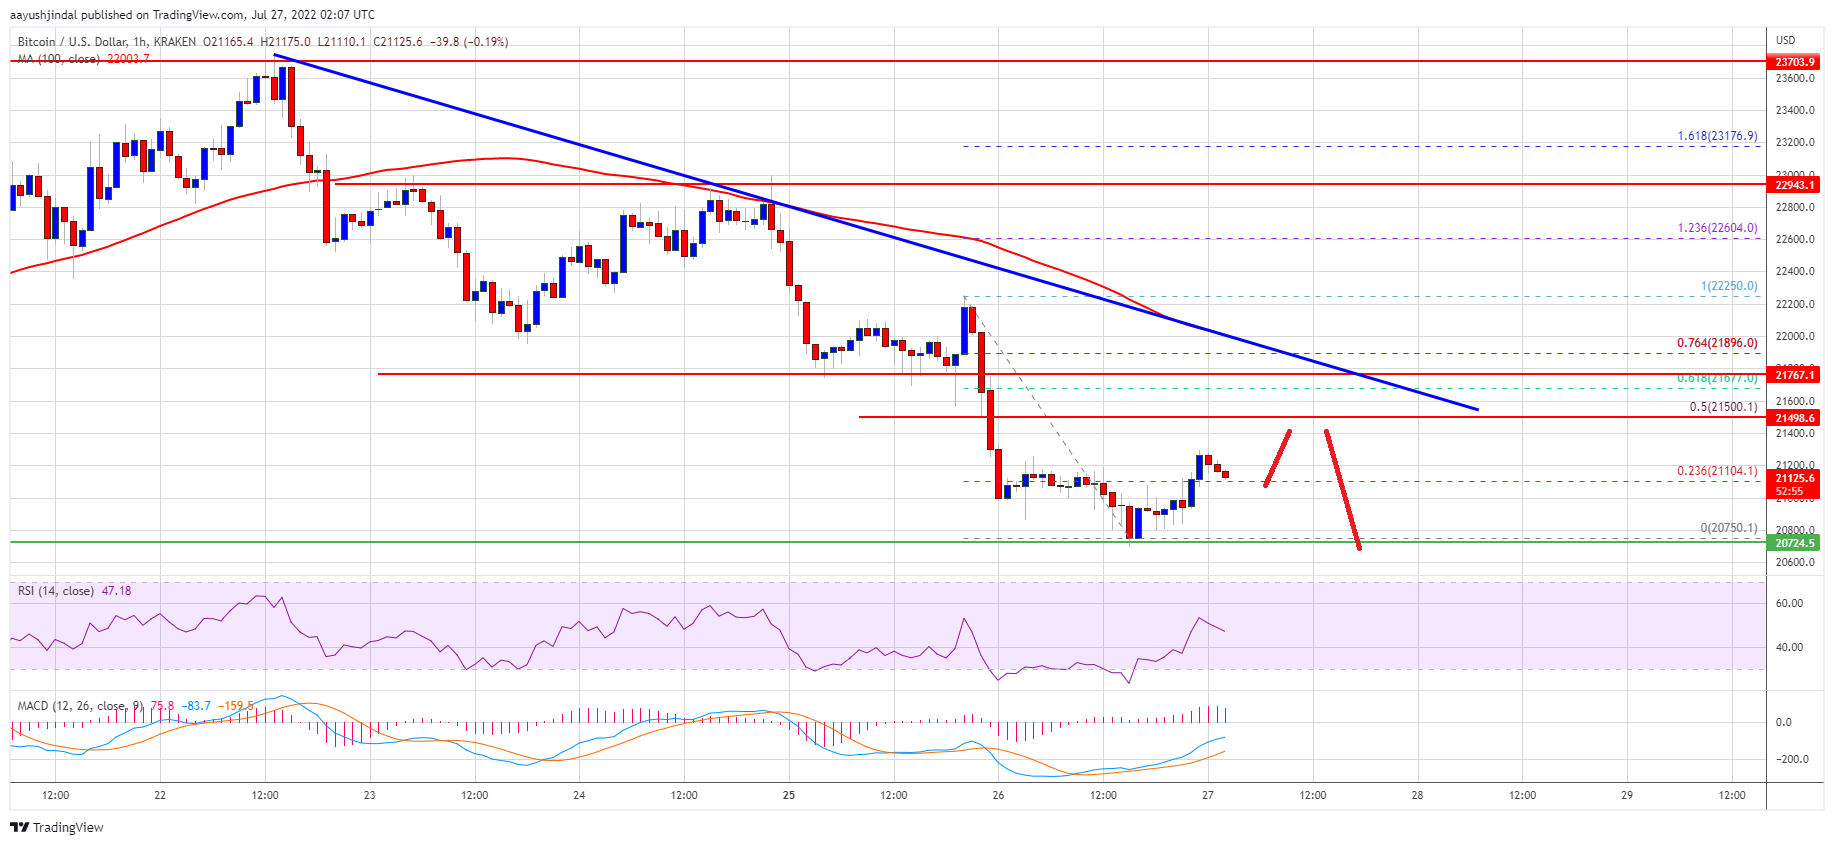
On the upside, bitcoin price could face resistance near the $21,500 level. It is near the 50% Fib retracement level of the recent drop from the $22,250 swing high to $20,750 low. The next key resistance is near the $21,650 zone. There is also a key bearish trend line forming with resistance near $21,650 on the hourly chart of the BTC/USD pair.
Source: BTCUSD on TradingView.com
A close above the $21,650 resistance zone could set the pace for a decent increase. In the stated case, the price may perhaps rise towards the $22,000 level. The next major resistance sits near the $22,500 level.
More Losses in BTC?
If bitcoin fails to start a recovery wave above the $21,500 level, it could continue to move down. An immediate support on the downside is near the $21,000 level.
The next major support now sits near the $20,750 and $20,500 levels. A close below the $20,500 support zone might increase selling pressure and the price might test $20,000 in the near term.
Technical indicators:
Hourly MACD – The MACD is now losing pace in the bearish zone.
Hourly RSI (Relative Strength Index) – The RSI for BTC/USD is now near the 50 level.
Major Support Levels – $21,000, followed by $20,750.
Major Resistance Levels – $21,500, $21,650 and $22,000.
Bitcoin extended losses below the $21,000 support against the US Dollar. BTC is consolidating and any upsides might face hurdles near $21,500.
Bitcoin remained in a bearish zone and traded below the $21,000 level.
The price is now trading below the $21,500 level and the 100 hourly simple moving average.
There is a key bearish trend line forming with resistance near $21,650 on the hourly chart of the BTC/USD pair (data feed from Kraken).
The pair might correct higher but upsides might be limited above $21,500.
Bitcoin price remained in a bearish zone after it settled below the $22,000 support zone. It consolidated near the $21,000 zone for some time before there were more losses.
The price declined below the $21,000 level but downsides were limited. A low is formed near $20,750 and the price is now consolidating losses. It is now trading below the $21,500 level and the 100 hourly simple moving average.
There was a minor upside above the $21,000 level. The price cleared the 23.6% Fib retracement level of the recent drop from the $22,250 swing high to $20,750 low.
On the upside, bitcoin price could face resistance near the $21,500 level. It is near the 50% Fib retracement level of the recent drop from the $22,250 swing high to $20,750 low. The next key resistance is near the $21,650 zone. There is also a key bearish trend line forming with resistance near $21,650 on the hourly chart of the BTC/USD pair.
Source: BTCUSD on TradingView.com
A close above the $21,650 resistance zone could set the pace for a decent increase. In the stated case, the price may perhaps rise towards the $22,000 level. The next major resistance sits near the $22,500 level.
If bitcoin fails to start a recovery wave above the $21,500 level, it could continue to move down. An immediate support on the downside is near the $21,000 level.
The next major support now sits near the $20,750 and $20,500 levels. A close below the $20,500 support zone might increase selling pressure and the price might test $20,000 in the near term.
Technical indicators:
Hourly MACD – The MACD is now losing pace in the bearish zone.
Hourly RSI (Relative Strength Index) – The RSI for BTC/USD is now near the 50 level.
Major Support Levels – $21,000, followed by $20,750.
Major Resistance Levels – $21,500, $21,650 and $22,000.
Tags: bitcoinbtcusdBTCUSDTxbtusd
FeedzyRead More
Crypto analyst Axel Adler Jr. has provided some insights on the current status of the…
Bitcoin has been trading sideways since mid-January, moving within a tight range between its all-time…
Bitcoin (BTC), the leading cryptocurrency by market value and the only macro asset open for…
After a fantastic January, where it rallied nearly 10%, Bitcoin closed over $100K to produce…
Following through on threats made throughout his campaign and repeated in the opening days of…
Crypto analyst Kevin Capital has suggested that the Bitcoin price may be in trouble. This…