TA: Bitcoin Price Could Narrowly Avoid a Major Downtrend, Here’s How
Bitcoin extended losses below the $22,650 support against the US Dollar. BTC is attempting another recovery and might face hurdles near $23,100.
Bitcoin remained in a bearish zone and extended losses below the $23,500 level.
The price is now trading below the $23,000 level and the 100 hourly simple moving average.
There was a break above a short-term bearish trend line with resistance near $22,850 on the hourly chart of the BTC/USD pair (data feed from Kraken).
The pair must clear the $23,100 resistance to start a steady increase in the near term.
Bitcoin Price Faces Resistance
Bitcoin price started a fresh decline after it faced sellers near the $23,570 level. The price gained bearish momentum after it broke the $23,000 support zone.
It even traded below the $22,800 level and the 100 hourly simple moving average. Finally, there was a spike below the $22,650 level. However, downsides were limited and the price traded as low as $22,400. The price started a fresh recovery wave above the $22,800 resistance zone.
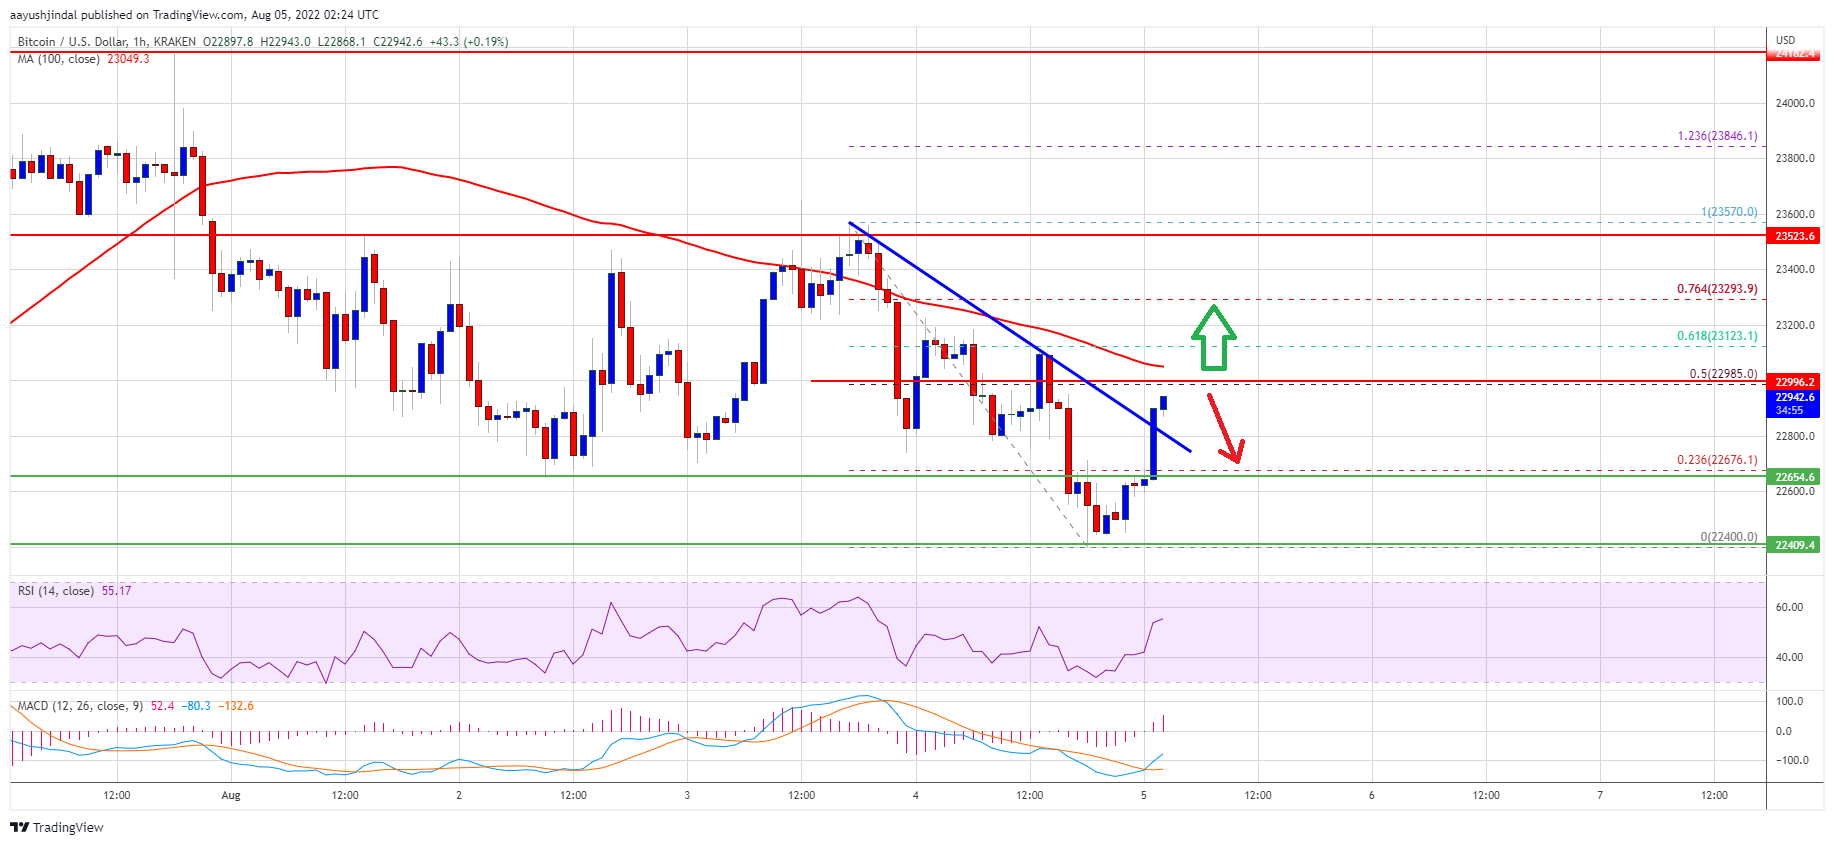
Bitcoin cleared the 23.6% Fib retracement level of the downward move from the $23,570 swing high to $22,400 low. Besides, there was a break above a short-term bearish trend line with resistance near $22,850 on the hourly chart of the BTC/USD pair.
It is now trading below the $23,000 level and the 100 hourly simple moving average. On the upside, bitcoin price is facing resistance near the $23,000 level and the 100 hourly SMA.
Source: BTCUSD on TradingView.com
The 50% Fib retracement level of the downward move from the $23,570 swing high to $22,400 low is also near the $23,000 zone. The next key resistance is near the $23,300 zone. A close above the $23,500 resistance zone could start a steady increase. In the stated case, the price may perhaps rise clear the $23,500 resistance.
More Losses in BTC?
If bitcoin fails to clear the $23,000 resistance zone and the 100 hourly SMA, it could continue to move down. An immediate support on the downside is near the $22,800 level.
The next major support now sits near the $22,400 level. A close below the $22,400 level might start a move towards $22,000. Any more losses might send the price towards $21,200 level.
Technical indicators:
Hourly MACD – The MACD is now gaining pace in the bullish zone.
Hourly RSI (Relative Strength Index) – The RSI for BTC/USD is now above the 50 level.
Major Support Levels – $22,800, followed by $22,400.
Major Resistance Levels – $23,000, $23,300 and $24,500.
Bitcoin extended losses below the $22,650 support against the US Dollar. BTC is attempting another recovery and might face hurdles near $23,100.
Bitcoin remained in a bearish zone and extended losses below the $23,500 level.
The price is now trading below the $23,000 level and the 100 hourly simple moving average.
There was a break above a short-term bearish trend line with resistance near $22,850 on the hourly chart of the BTC/USD pair (data feed from Kraken).
The pair must clear the $23,100 resistance to start a steady increase in the near term.
Bitcoin Price Faces Resistance
Bitcoin price started a fresh decline after it faced sellers near the $23,570 level. The price gained bearish momentum after it broke the $23,000 support zone.
It even traded below the $22,800 level and the 100 hourly simple moving average. Finally, there was a spike below the $22,650 level. However, downsides were limited and the price traded as low as $22,400. The price started a fresh recovery wave above the $22,800 resistance zone.
Bitcoin cleared the 23.6% Fib retracement level of the downward move from the $23,570 swing high to $22,400 low. Besides, there was a break above a short-term bearish trend line with resistance near $22,850 on the hourly chart of the BTC/USD pair.
It is now trading below the $23,000 level and the 100 hourly simple moving average. On the upside, bitcoin price is facing resistance near the $23,000 level and the 100 hourly SMA.
Source: BTCUSD on TradingView.com
The 50% Fib retracement level of the downward move from the $23,570 swing high to $22,400 low is also near the $23,000 zone. The next key resistance is near the $23,300 zone. A close above the $23,500 resistance zone could start a steady increase. In the stated case, the price may perhaps rise clear the $23,500 resistance.
More Losses in BTC?
If bitcoin fails to clear the $23,000 resistance zone and the 100 hourly SMA, it could continue to move down. An immediate support on the downside is near the $22,800 level.
The next major support now sits near the $22,400 level. A close below the $22,400 level might start a move towards $22,000. Any more losses might send the price towards $21,200 level.
Technical indicators:
Hourly MACD – The MACD is now gaining pace in the bullish zone.
Hourly RSI (Relative Strength Index) – The RSI for BTC/USD is now above the 50 level.
Major Support Levels – $22,800, followed by $22,400.
Major Resistance Levels – $23,000, $23,300 and $24,500.
Tags: bitcoinbtcusdBTCUSDTxbtusd
NewsBTCRead More


Recent Posts
Arizona Becomes Second State to Establish Strategic Bitcoin Reserve
Bitcoin Magazine Arizona Becomes Second State to Establish Strategic Bitcoin Reserve Arizona has made history…
What is a Strategic Bitcoin Reserve?
Bitcoin Magazine What is a Strategic Bitcoin Reserve? A Strategic Bitcoin Reserve is a designated…
Bitcoin $120K Target for 2Q May Be Too Conservative: Standard Chartered
Bitcoin (BTC) is poised to hit a new record high, with investment flows now the…
Sculpting Scarcity: Artist Maxfield Mellenbruch Brings Rare Steak Worth Millions To Bitcoin 2025
Bitcoin Magazine Sculpting Scarcity: Artist Maxfield Mellenbruch Brings Rare Steak Worth Millions To Bitcoin 2025 …
Bitcoin Tops $100K for First Time in 3 Months; Are Upside Targets Too Low?
Bitcoin is back in six figures, continuing yet another of its famous zigs when most…
Standard Chartered Analyst Apologizes For $120K Bitcoin Price Prediction, Says It Is Too Low
Bitcoin Magazine Standard Chartered Analyst Apologizes For $120K Bitcoin Price Prediction, Says It Is Too…