TA: Bitcoin Price Could Recover If It Holds This Key Support
Bitcoin extended losses and traded below $19,600 against the US Dollar. BTC could start a recovery wave if it stays above the $19,300 support zone.
Bitcoin remained in a bearish zone and settled below the $20,000 level.
The price is now trading below the $19,600 level and the 100 hourly simple moving average.
There is a major bearish trend line forming with resistance near $19,600 on the hourly chart of the BTC/USD pair (data feed from Kraken).
The pair might start a recovery wave if it stays above the $19,300 support zone.
Bitcoin Price Reaches Key Support
Bitcoin price started a fresh decline below the $21,000 support zone. The bears gained strength and pushed the price below the $20,000 support zone.
The decline even extended below the $19,600 support zone. A low is formed near $19,256 and the price is now consolidating near a major support at $19,300. It is also trading below the $19,600 level and the 100 hourly simple moving average.
If bitcoin stays above the $19,300 zone, it might start a recovery wave. On the upside, the price could resistance near the $19,550 and $19,600 levels.
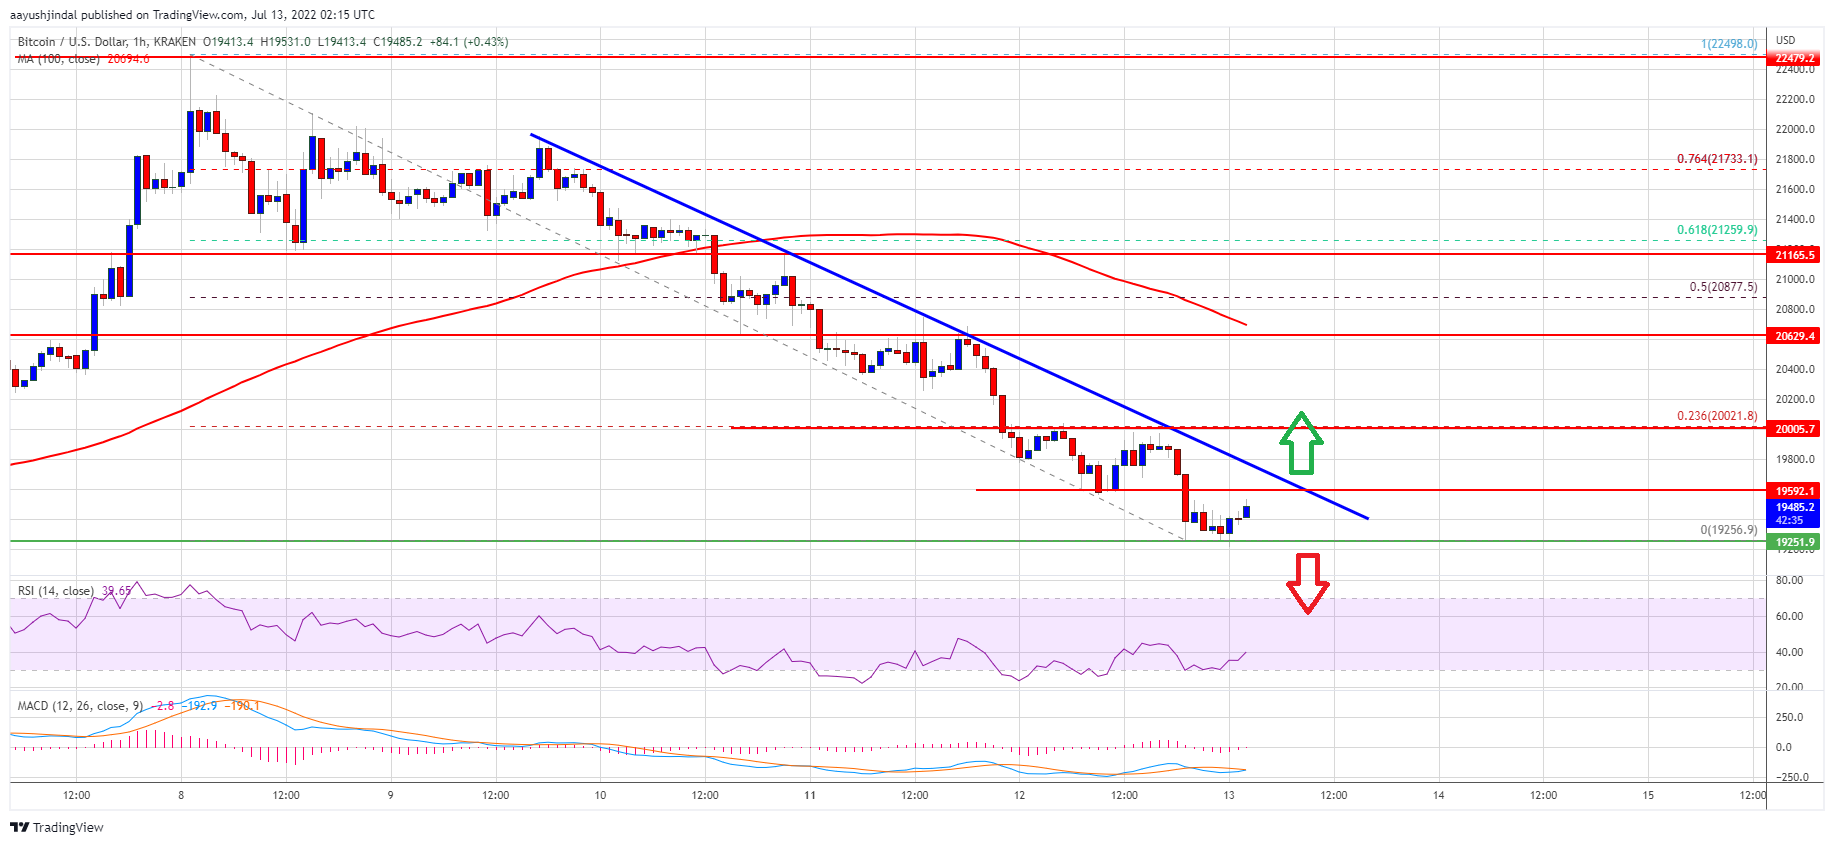
There is also a major bearish trend line forming with resistance near $19,600 on the hourly chart of the BTC/USD pair. The next key resistance is near the $20,000 zone (the recent breakdown zone). It is near the 23.6% Fib retracement level of the downward move from the $22,498 swing high to $19,256 low.
Source: BTCUSD on TradingView.com
A close above the $20,000 resistance zone could set the pace for a test of the 100 hourly simple moving average. Any more gains might open the doors for a move towards the 50% Fib retracement level of the downward move from the $22,498 swing high to $19,256 low. The next major resistance sits near the $21,200 level.
More Losses in BTC?
If bitcoin fails to start a recovery wave above the $20,000 level, it could continue to move down. An immediate support on the downside is near the $19,300 level.
The next major support now sits near the $19,250 level or the recent low. A close below the $19,250 support zone could accelerate losses. In the stated case, there is a risk of a move towards the $18,500 level.
Technical indicators:
Hourly MACD – The MACD is now gaining pace in the bearish zone.
Hourly RSI (Relative Strength Index) – The RSI for BTC/USD is now in the oversold zone.
Major Support Levels – $19,300, followed by $18,500.
Major Resistance Levels – $19,600, $20,000 and $20,500.
Bitcoin extended losses and traded below $19,600 against the US Dollar. BTC could start a recovery wave if it stays above the $19,300 support zone.
Bitcoin remained in a bearish zone and settled below the $20,000 level.
The price is now trading below the $19,600 level and the 100 hourly simple moving average.
There is a major bearish trend line forming with resistance near $19,600 on the hourly chart of the BTC/USD pair (data feed from Kraken).
The pair might start a recovery wave if it stays above the $19,300 support zone.
Bitcoin Price Reaches Key Support
Bitcoin price started a fresh decline below the $21,000 support zone. The bears gained strength and pushed the price below the $20,000 support zone.
The decline even extended below the $19,600 support zone. A low is formed near $19,256 and the price is now consolidating near a major support at $19,300. It is also trading below the $19,600 level and the 100 hourly simple moving average.
If bitcoin stays above the $19,300 zone, it might start a recovery wave. On the upside, the price could resistance near the $19,550 and $19,600 levels.
There is also a major bearish trend line forming with resistance near $19,600 on the hourly chart of the BTC/USD pair. The next key resistance is near the $20,000 zone (the recent breakdown zone). It is near the 23.6% Fib retracement level of the downward move from the $22,498 swing high to $19,256 low.
Source: BTCUSD on TradingView.com
A close above the $20,000 resistance zone could set the pace for a test of the 100 hourly simple moving average. Any more gains might open the doors for a move towards the 50% Fib retracement level of the downward move from the $22,498 swing high to $19,256 low. The next major resistance sits near the $21,200 level.
More Losses in BTC?
If bitcoin fails to start a recovery wave above the $20,000 level, it could continue to move down. An immediate support on the downside is near the $19,300 level.
The next major support now sits near the $19,250 level or the recent low. A close below the $19,250 support zone could accelerate losses. In the stated case, there is a risk of a move towards the $18,500 level.
Technical indicators:
Hourly MACD – The MACD is now gaining pace in the bearish zone.
Hourly RSI (Relative Strength Index) – The RSI for BTC/USD is now in the oversold zone.
Major Support Levels – $19,300, followed by $18,500.
Major Resistance Levels – $19,600, $20,000 and $20,500.
Tags: bitcoinbtcusdBTCUSDTxbtusd
FeedzyRead More


Recent Posts
Bitcoin Faces Triple Resistance As Price Rejection Persists
Over the past trading week, Bitcoin (BTC) failed to make any significant price breakout, experiencing…
Whales Swallowing Bitcoin Fast — Will This Push BTC Price Up?
Large investors are buying Bitcoin at record levels, which may be the precursor to a…
Bitcoin Faces Critical Resistance At $91,000 As Short-Term Holders Hover At Break-Even
Bitcoin prices gained by only 0.95% in the past week amidst an intense market consolidation.…
Bitcoin Outshines Gold By Over 13,000% — ‘Let The Numbers Speak’, Expert Says
Bitcoin has risen dramatically over the last 10 years against gold, with a rise of…
Bitcoin Dominance At Risk Of Crash To 40%, Why This Is Good For Ethereum, XRP, And Altcoins
The Bitcoin dominance in the cryptocurrency market is inching dangerously close to a long-term resistance…
Best Altcoins to Buy as Long-Term $BTC Holders Continue to Remain in Profit Despite Recent Turbulence
Bitcoin has remained sideways for the last couple of months, tossing between the $88K and…