TA: Bitcoin Price Dives Below $20K, Why BTC Is Vulnerable To More Losses
Bitcoin started a major decline and traded below $20,000 against the US Dollar. BTC remains at a risk of more losses unless it recovers above $20,000.
Bitcoin started another decline below the $20,200 and $20,000 levels.
The price is now trading below the $20,000 level and the 100 hourly simple moving average.
There is a key bearish trend line forming with resistance near $20,000 on the hourly chart of the BTC/USD pair (data feed from Kraken).
The pair could accelerate further lower below the $19,500 support zone in the coming sessions.
Bitcoin Price Takes Hit
Bitcoin price failed to recover above the $22,000 resistance zone. BTC started a fresh decline below the $21,200 and $21,000 support levels.
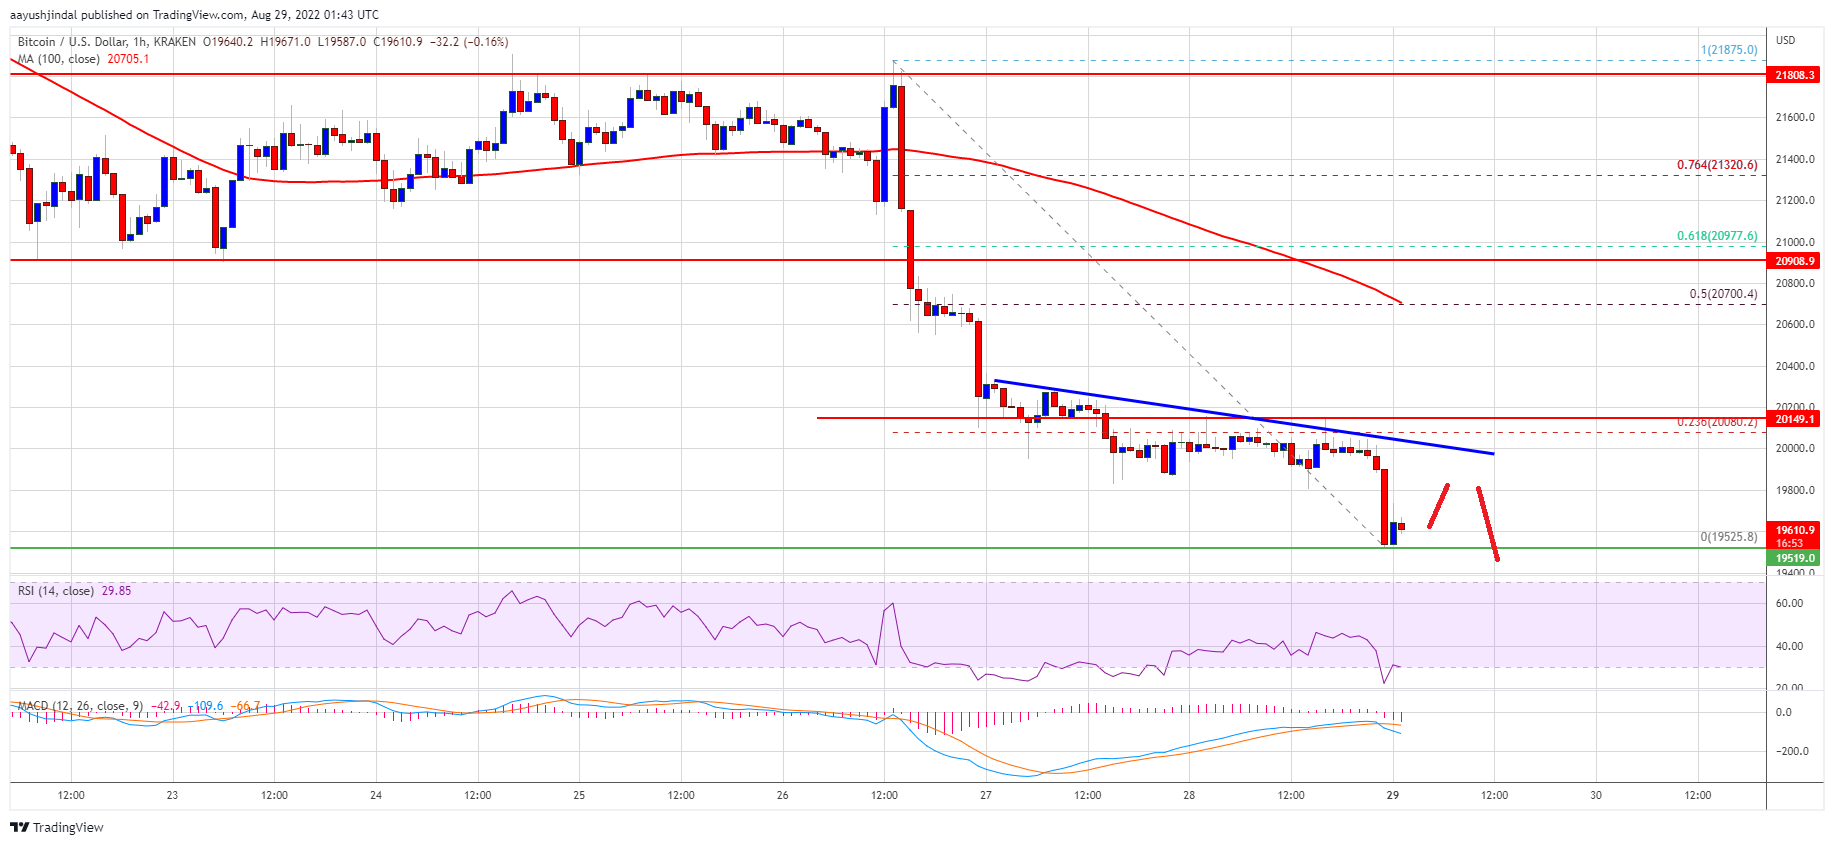
The bears gained strength for a push below the $20,000 support zone. The price settled below the $20,000 level and the 100 hourly simple moving average. A low is formed near $19,525 and the price is now consolidating losses.
On the upside, an immediate resistance is near the $19,800 level. The first major resistance sits near the $20,000 level. It is near the 23.6% Fib retracement level of the downward move from the $21,875 swing high to $19,525 low.
Besides, there is a key bearish trend line forming with resistance near $20,000 on the hourly chart of the BTC/USD pair. Bitcoin price must clear the $20,000 resistance zone to start a recovery wave.
Source: BTCUSD on TradingView.com
The next major resistance could be near the $20,700 zone. It is close to the 50% Fib retracement level of the downward move from the $21,875 swing high to $19,525 low. Any more gains might send the price towards the $21,000 resistance zone.
More Losses in BTC?
If bitcoin fails to clear the $20,000 resistance zone, it could continue to move down. An immediate support on the downside is near the $19,500 level and the recent low.
The next major support sits near the $19,200 level. A close below the $19,200 support might spark a sharp decline. In the stated case, the price might decline towards the $18,500 level in the coming sessions.
Technical indicators:
Hourly MACD – The MACD is now gaining pace in the bearish zone.
Hourly RSI (Relative Strength Index) – The RSI for BTC/USD is now below the 50 level.
Major Support Levels – $19,500, followed by $19,200.
Major Resistance Levels – $19,800, $20,000 and $21,000.
Bitcoin started a major decline and traded below $20,000 against the US Dollar. BTC remains at a risk of more losses unless it recovers above $20,000.
Bitcoin started another decline below the $20,200 and $20,000 levels.
The price is now trading below the $20,000 level and the 100 hourly simple moving average.
There is a key bearish trend line forming with resistance near $20,000 on the hourly chart of the BTC/USD pair (data feed from Kraken).
The pair could accelerate further lower below the $19,500 support zone in the coming sessions.
Bitcoin Price Takes Hit
Bitcoin price failed to recover above the $22,000 resistance zone. BTC started a fresh decline below the $21,200 and $21,000 support levels.
The bears gained strength for a push below the $20,000 support zone. The price settled below the $20,000 level and the 100 hourly simple moving average. A low is formed near $19,525 and the price is now consolidating losses.
On the upside, an immediate resistance is near the $19,800 level. The first major resistance sits near the $20,000 level. It is near the 23.6% Fib retracement level of the downward move from the $21,875 swing high to $19,525 low.
Besides, there is a key bearish trend line forming with resistance near $20,000 on the hourly chart of the BTC/USD pair. Bitcoin price must clear the $20,000 resistance zone to start a recovery wave.
Source: BTCUSD on TradingView.com
The next major resistance could be near the $20,700 zone. It is close to the 50% Fib retracement level of the downward move from the $21,875 swing high to $19,525 low. Any more gains might send the price towards the $21,000 resistance zone.
More Losses in BTC?
If bitcoin fails to clear the $20,000 resistance zone, it could continue to move down. An immediate support on the downside is near the $19,500 level and the recent low.
The next major support sits near the $19,200 level. A close below the $19,200 support might spark a sharp decline. In the stated case, the price might decline towards the $18,500 level in the coming sessions.
Technical indicators:
Hourly MACD – The MACD is now gaining pace in the bearish zone.
Hourly RSI (Relative Strength Index) – The RSI for BTC/USD is now below the 50 level.
Major Support Levels – $19,500, followed by $19,200.
Major Resistance Levels – $19,800, $20,000 and $21,000.
Tags: bitcoinbtcusdBTCUSDTxbtusd
NewsBTCRead More


Recent Posts
Bitcoin Whale Entry Prices Diverge Sharply – Confidence Builds At Higher Levels
Bitcoin has surged to $104,300, confirming the uptrend and reinforcing the bullish outlook that many…
Sovereigns Are Buying Billions Of Bitcoin, Says Anthony Scaramucci
Bitcoin blasted back through the psychologically charged $100,000 threshold for only the second time in…
Hut 8 Posts $134M Q1 Loss Amid Strategic Shift Toward Energy Infrastructure and Bitcoin Mining
Bitcoin Magazine Hut 8 Posts $134M Q1 Loss Amid Strategic Shift Toward Energy Infrastructure and…
Matador Technologies Raising C$1 Million to Invest in Bitcoin
Bitcoin Magazine Matador Technologies Raising C$1 Million to Invest in Bitcoin Matador Technologies Inc. (“Matador”…
Coinbase Launches 24/7 Bitcoin Futures Trading in the U.S.
Bitcoin Magazine Coinbase Launches 24/7 Bitcoin Futures Trading in the U.S. Coinbase has made a…
Bitcoin Miner MARA Stock Surges Despite Earnings Miss as Analysts Applaud Cost Cutting
Bitcoin miner MARA Holdings (MARA) stock outperformed peers on Friday, even after its first quarter…