Bitcoin started a steady increase above the $21,000 resistance against the US Dollar. BTC could rise further towards $22,000 if it stays above the $20,500 support.
Bitcoin is slowly moving higher above the $21,000 resistance zone.
The price is now trading above the $20,800 level and testing the 100 hourly simple moving average.
There was a break above a short-term bearish trend line with resistance near $21,000 on the hourly chart of the BTC/USD pair (data feed from Kraken).
The pair might gain bullish momentum if it clears the $21,500 and $21,600 levels.
Bitcoin Price Shows Positive Signs
Bitcoin price formed a base above the $19,200 level and started a decent increase. The price traded above the $20,500 resistance zone to move into a positive zone.
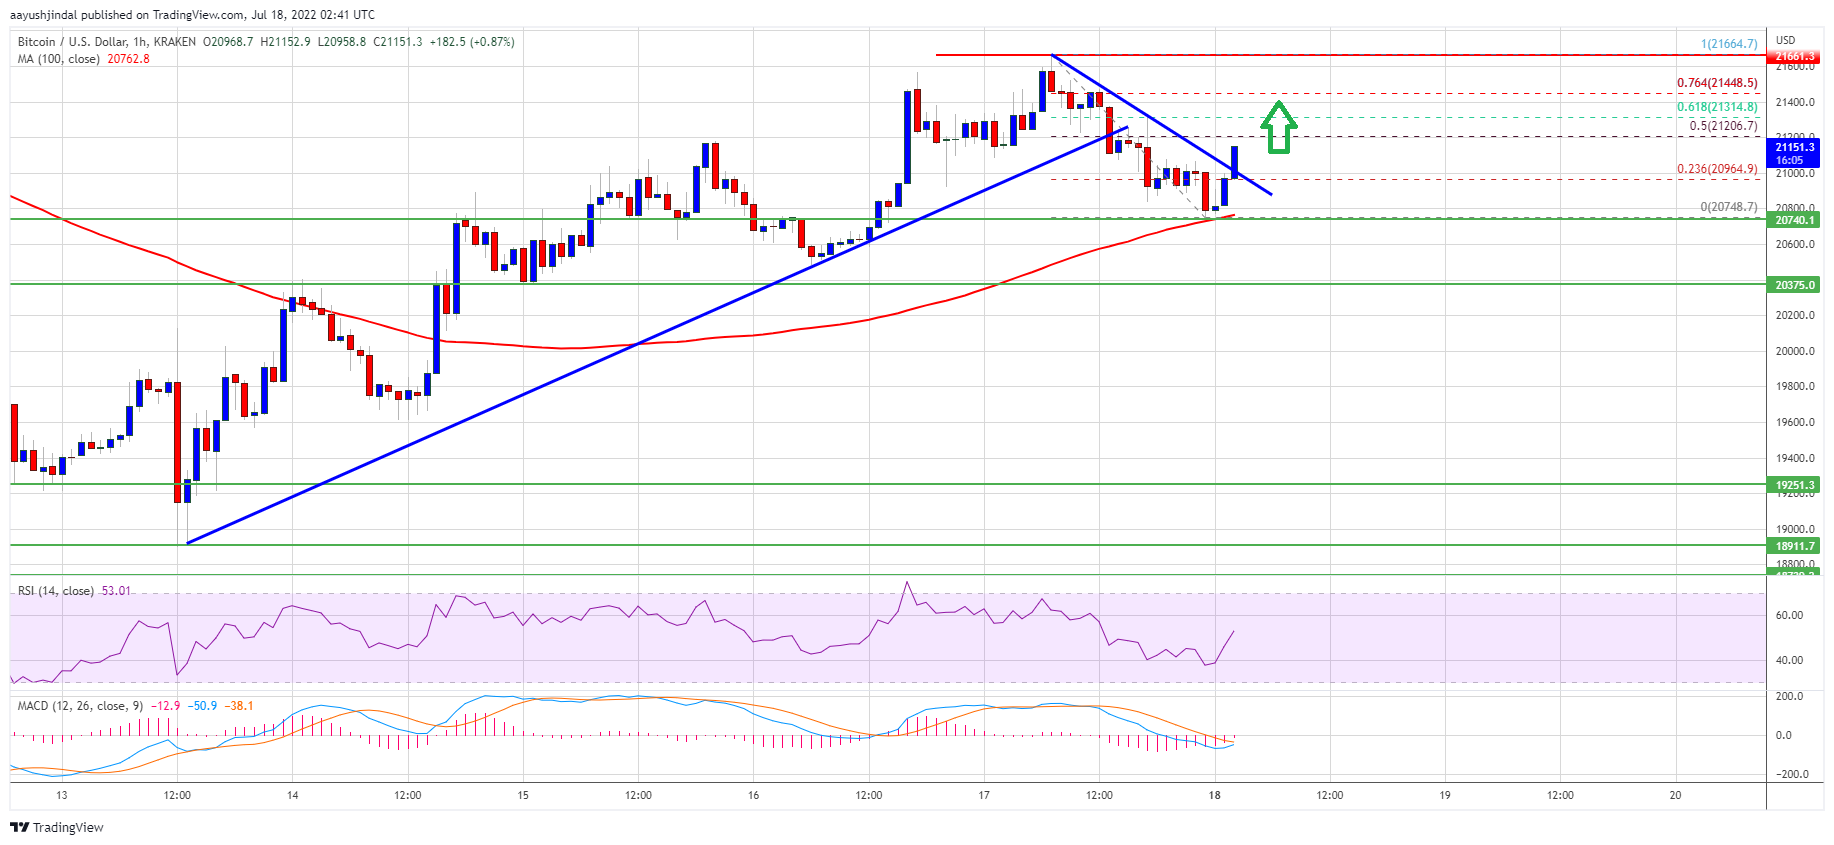
The price even gained pace above the $21,000 level and settled above the 100 hourly simple moving average. A high was formed near $21,664 before there was a downside correction. The price traded below the $21,000 level, but the bulls were active near the $20,750 zone and the 100 hourly simple moving average.
A low was formed near $20,748 and the price is now rising. It broke the 23.6% Fib retracement level of the downward move from the $21,664 swing high to $20,748 low.
There was also a break above a short-term bearish trend line with resistance near $21,000 on the hourly chart of the BTC/USD pair. On the upside, bitcoin price could resistance near the $21,200 level. It is near the 50% Fib retracement level of the downward move from the $21,664 swing high to $20,748 low.
Source: BTCUSD on TradingView.com
The next key resistance is near the $21,500 zone. A close above the $21,500 resistance zone could set the pace for a decent increase. In the stated case, the price may perhaps rise towards the $22,000 level. The next major resistance sits near the $22,800 level.
Dips Supported in BTC?
If bitcoin fails to clear the $21,500 resistance zone, it could start a downside correction. An immediate support on the downside is near the $21,000 level.
The next major support now sits near the $20,750 level and the 100 hourly SMA. A clear move below the $20,750 support might send the price towards $20,500.
Technical indicators:
Hourly MACD – The MACD is now gaining pace in the bullish zone.
Hourly RSI (Relative Strength Index) – The RSI for BTC/USD is now above the 50 level.
Major Support Levels – $21,000, followed by $20,750.
Major Resistance Levels – $21,200, $21,500 and $22,000.
Bitcoin started a steady increase above the $21,000 resistance against the US Dollar. BTC could rise further towards $22,000 if it stays above the $20,500 support.
Bitcoin is slowly moving higher above the $21,000 resistance zone.
The price is now trading above the $20,800 level and testing the 100 hourly simple moving average.
There was a break above a short-term bearish trend line with resistance near $21,000 on the hourly chart of the BTC/USD pair (data feed from Kraken).
The pair might gain bullish momentum if it clears the $21,500 and $21,600 levels.
Bitcoin price formed a base above the $19,200 level and started a decent increase. The price traded above the $20,500 resistance zone to move into a positive zone.
The price even gained pace above the $21,000 level and settled above the 100 hourly simple moving average. A high was formed near $21,664 before there was a downside correction. The price traded below the $21,000 level, but the bulls were active near the $20,750 zone and the 100 hourly simple moving average.
A low was formed near $20,748 and the price is now rising. It broke the 23.6% Fib retracement level of the downward move from the $21,664 swing high to $20,748 low.
There was also a break above a short-term bearish trend line with resistance near $21,000 on the hourly chart of the BTC/USD pair. On the upside, bitcoin price could resistance near the $21,200 level. It is near the 50% Fib retracement level of the downward move from the $21,664 swing high to $20,748 low.
Source: BTCUSD on TradingView.com
The next key resistance is near the $21,500 zone. A close above the $21,500 resistance zone could set the pace for a decent increase. In the stated case, the price may perhaps rise towards the $22,000 level. The next major resistance sits near the $22,800 level.
If bitcoin fails to clear the $21,500 resistance zone, it could start a downside correction. An immediate support on the downside is near the $21,000 level.
The next major support now sits near the $20,750 level and the 100 hourly SMA. A clear move below the $20,750 support might send the price towards $20,500.
Technical indicators:
Hourly MACD – The MACD is now gaining pace in the bullish zone.
Hourly RSI (Relative Strength Index) – The RSI for BTC/USD is now above the 50 level.
Major Support Levels – $21,000, followed by $20,750.
Major Resistance Levels – $21,200, $21,500 and $22,000.
Tags: bitcoinbtcusdBTCUSDTxbtusd
FeedzyRead More
Crypto analyst Merlijn has described the Bitcoin price crash to $91,000 as a major bear…
Blockchain firm Neptune Digital Assets (NDA) said it bought 1 million dogecoin (DOGE) tokens through…
In the aftermath of yesterday’s Bitcoin crash, market participants are closely examining whether the leading…
Bitcoin (BTC) and other cryptocurrencies are experiencing renewed selling pressure as escalating trade tensions between…
Almost half of the state governments in the U.S. are either on a path toward…
By Omkar Godbole (All times ET unless indicated otherwise) If you follow financial markets, you've…