Bitcoin made another attempt to gain pace above the $45,000 resistance against the US Dollar. BTC is still consolidating and remain supported near $43,000.
Bitcoin spiked above the $45,000 resistance zone and traded as high as $45,349.
The price is trading above $43,000 and the 100 hourly simple moving average.
There is a major bullish trend line forming with support near $42,500 on the hourly chart of the BTC/USD pair (data feed from Kraken).
The pair could correct lower, but the bulls might be active near $43,000 or $42,500.
Bitcoin Price Remains Supported
Bitcoin price remained supported above the $43,000 level. BTC made another attempt to start a fresh increase above the $44,500 level. It even spiked above the $45,000 resistance level.
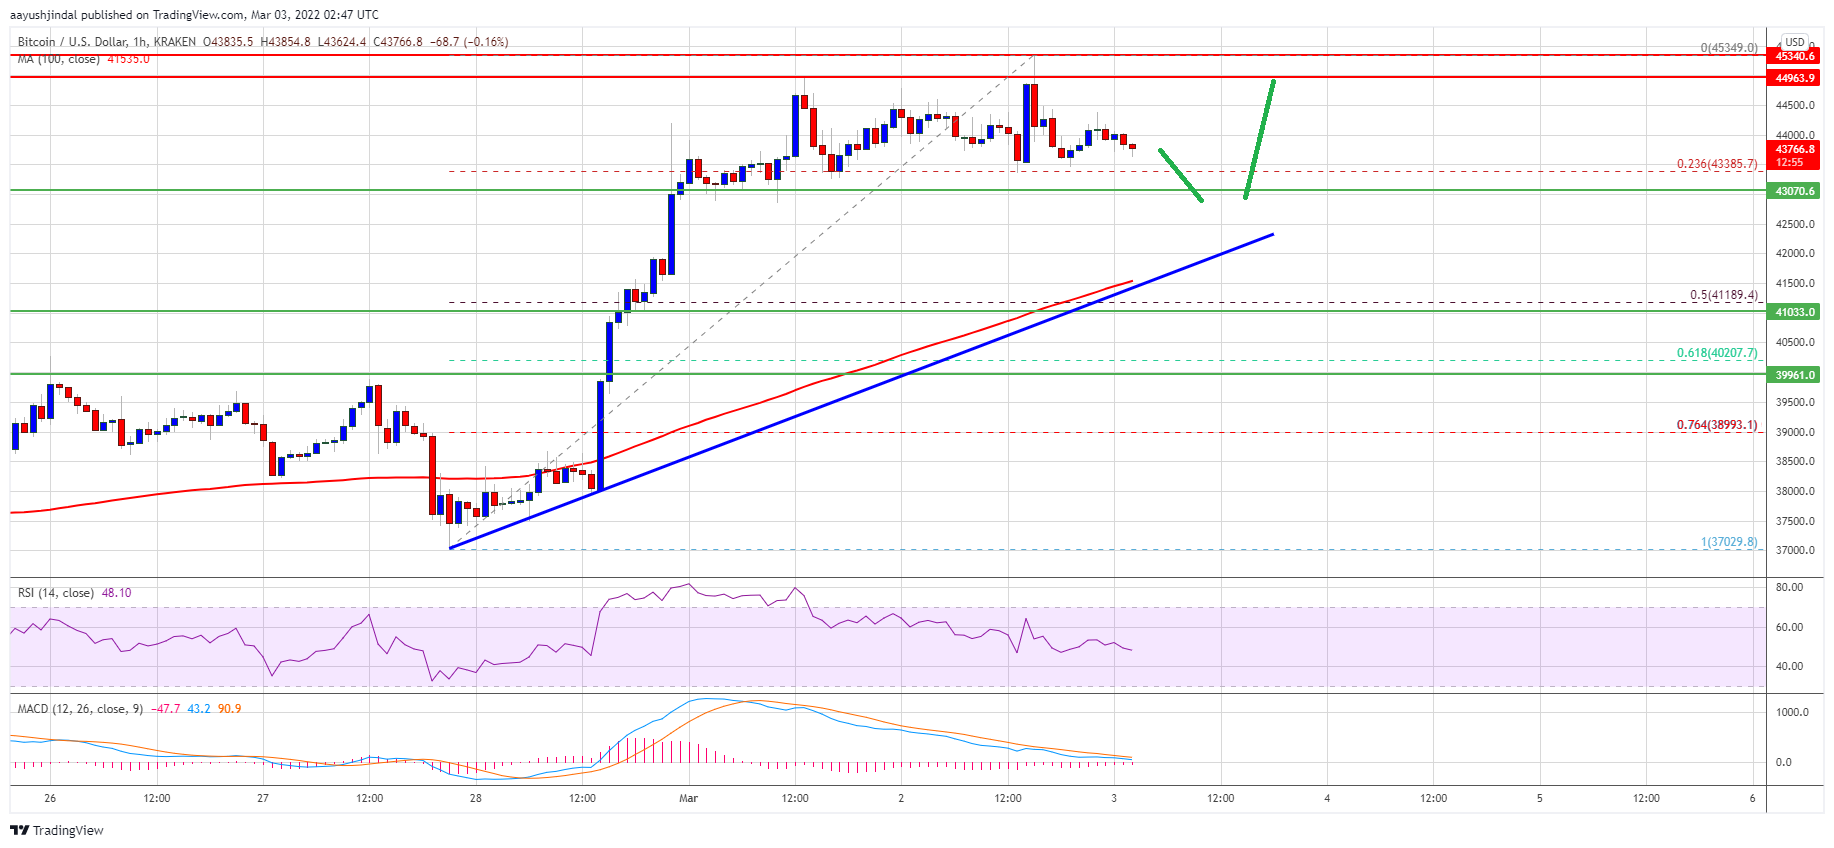
However, there was no upside continuation above $45,350. A high was formed near $45,349 and the price is now correcting gains. There was a move below the $45,000 and $44,500 levels. The price also tested the 23.6% Fib retracement level of the upward move from the $37,030 swing low to $45,349 high.
It is now trading above $43,000 and the 100 hourly simple moving average. There is also a major bullish trend line forming with support near $42,500 on the hourly chart of the BTC/USD pair.
Source: BTCUSD on TradingView.com
Bitcoin is now facing resistance is near the $44,250 level. The first key resistance is near the $45,000 level. A clear move above the $45,000 resistance might set the pace for a larger increase. In the stated case, the price could surpass $45,500 and test the $46,500 resistance zone. The next major resistance for the bulls may possibly be near the $47,200 level.
Dips Limited in BTC?
If bitcoin fails to clear the $45,000 resistance zone, it could start a downside correction. An immediate support on the downside is near the $43,380 zone.
The next major support is seen near the $43,000 level or the trend line support. If there is a downside break below the trend line support, the price might gain decline towards $41,200. It is near the 50% Fib retracement level of the upward move from the $37,030 swing low to $45,349 high.
Technical indicators:
Hourly MACD – The MACD is now losing pace in the bullish zone.
Hourly RSI (Relative Strength Index) – The RSI for BTC/USD is now near the 50 level.
Major Support Levels – $43,380, followed by $42,500.
Major Resistance Levels – $44,250, $45,000 and $45,350.
Bitcoin made another attempt to gain pace above the $45,000 resistance against the US Dollar. BTC is still consolidating and remain supported near $43,000.
Bitcoin spiked above the $45,000 resistance zone and traded as high as $45,349.
The price is trading above $43,000 and the 100 hourly simple moving average.
There is a major bullish trend line forming with support near $42,500 on the hourly chart of the BTC/USD pair (data feed from Kraken).
The pair could correct lower, but the bulls might be active near $43,000 or $42,500.
Bitcoin price remained supported above the $43,000 level. BTC made another attempt to start a fresh increase above the $44,500 level. It even spiked above the $45,000 resistance level.
However, there was no upside continuation above $45,350. A high was formed near $45,349 and the price is now correcting gains. There was a move below the $45,000 and $44,500 levels. The price also tested the 23.6% Fib retracement level of the upward move from the $37,030 swing low to $45,349 high.
It is now trading above $43,000 and the 100 hourly simple moving average. There is also a major bullish trend line forming with support near $42,500 on the hourly chart of the BTC/USD pair.
Source: BTCUSD on TradingView.com
Bitcoin is now facing resistance is near the $44,250 level. The first key resistance is near the $45,000 level. A clear move above the $45,000 resistance might set the pace for a larger increase. In the stated case, the price could surpass $45,500 and test the $46,500 resistance zone. The next major resistance for the bulls may possibly be near the $47,200 level.
If bitcoin fails to clear the $45,000 resistance zone, it could start a downside correction. An immediate support on the downside is near the $43,380 zone.
The next major support is seen near the $43,000 level or the trend line support. If there is a downside break below the trend line support, the price might gain decline towards $41,200. It is near the 50% Fib retracement level of the upward move from the $37,030 swing low to $45,349 high.
Technical indicators:
Hourly MACD – The MACD is now losing pace in the bullish zone.
Hourly RSI (Relative Strength Index) – The RSI for BTC/USD is now near the 50 level.
Major Support Levels – $43,380, followed by $42,500.
Major Resistance Levels – $44,250, $45,000 and $45,350.
Tags: bitcoinbtcusdBTCUSDTxbtusd
FeedzyRead More
The price of Bitcoin (BTC) has shown only sideways movement in the last day resulting…
A sluggish Bitcoin price performance has not been the only disappointing theme for the largest…
World Liberty Financial, Trump’s crypto company, is making moves again. It recently bought another $1.4M…
Disclaimer: The analyst who wrote this piece owns shares of Strategy (MSTR) Strategy (MSTR) could…
Peter Brandt, a seasoned trader, has dismissed optimistic predictions in the wake of Bitcoin’s recent…
This article is part of a four-piece series on El Salvador. You can find the…