Bitcoin is showing a few positive signs above $19,000 against the US Dollar. BTC could gain bullish momentum if it clears the $19,400 resistance zone.
Bitcoin started an upside correction and climbed above $19,000.
The price is now testing the $19,400 zone and the 100 hourly simple moving average.
There was a break above a key bearish trend line with resistance near $19,200 on the hourly chart of the BTC/USD pair (data feed from Kraken).
The pair might start a decent increase if there is a clear move above the $19,500 resistance.
Bitcoin Price Attempts Upside Break
Bitcoin price found support near the $18,550 zone and recently started an upside correction. There was a steady recovery wave above the $19,000 resistance zone.
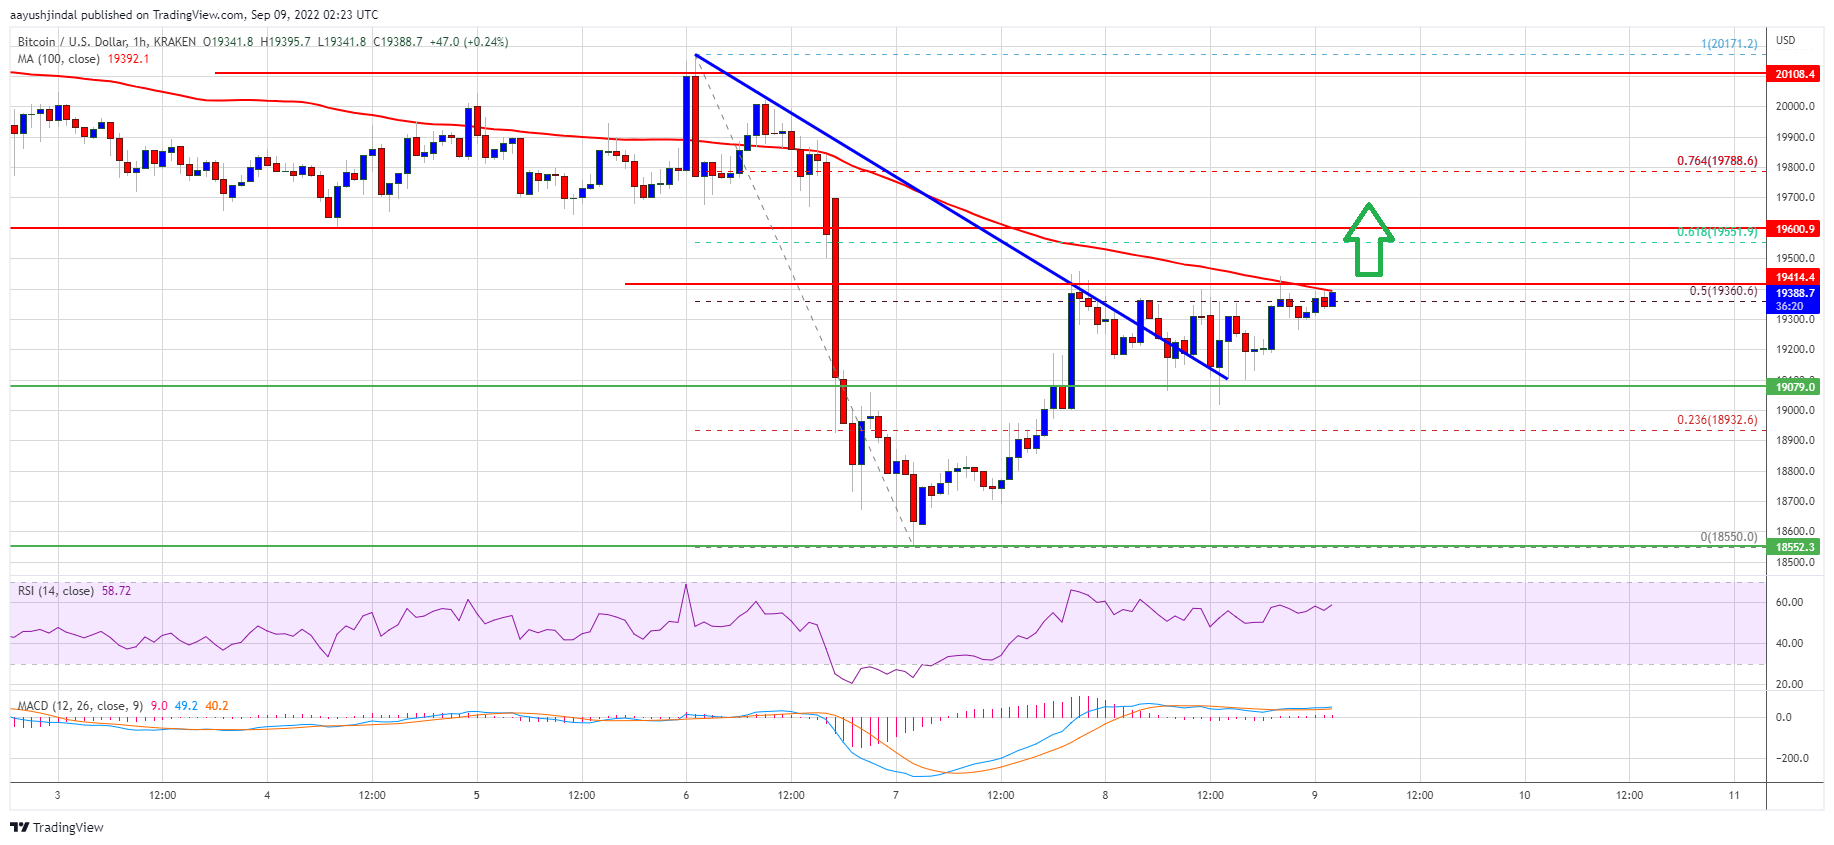
There was a break above a key bearish trend line with resistance near $19,200 on the hourly chart of the BTC/USD pair. The bulls were able to push the price above the 23.6% Fib retracement level of the downward move from the $20,172 swing high to $18,550 low.
Bitcoin price is now testing the $19,400 zone and the 100 hourly simple moving average. The price is also trading near the 50% Fib retracement level of the downward move from the $20,172 swing high to $18,550 low.
Source: BTCUSD on TradingView.com
On the upside, an immediate resistance is near the $19,400 level and the 100 hourly simple moving average. The next major resistance sits near the $19,500 level. A proper close above the $19,500 resistance might start a steady increase to $20,000. Any more gains might send the price towards the $20,500 resistance zone.
Fresh Decline in BTC?
If bitcoin fails to gain pace above the $19,500 zone, it could start another decline. An immediate support on the downside is near the $19,200 zone.
The first major support is now forming near the $19,070 level. A downside break below the $19,070 level might send the price towards the $18,550 support. Any more losses below $18,550 might put a lot of pressure on the bulls. In the stated case, the price could drop towards the $18,000 support in the near term.
Technical indicators:
Hourly MACD – The MACD is now gaining pace in the bullish zone.
Hourly RSI (Relative Strength Index) – The RSI for BTC/USD is now above the 50 level.
Major Support Levels – $19,070, followed by $18,550.
Major Resistance Levels – $19,400, $19,500 and $20,000.
Bitcoin is showing a few positive signs above $19,000 against the US Dollar. BTC could gain bullish momentum if it clears the $19,400 resistance zone.
Bitcoin started an upside correction and climbed above $19,000.
The price is now testing the $19,400 zone and the 100 hourly simple moving average.
There was a break above a key bearish trend line with resistance near $19,200 on the hourly chart of the BTC/USD pair (data feed from Kraken).
The pair might start a decent increase if there is a clear move above the $19,500 resistance.
Bitcoin price found support near the $18,550 zone and recently started an upside correction. There was a steady recovery wave above the $19,000 resistance zone.
There was a break above a key bearish trend line with resistance near $19,200 on the hourly chart of the BTC/USD pair. The bulls were able to push the price above the 23.6% Fib retracement level of the downward move from the $20,172 swing high to $18,550 low.
Bitcoin price is now testing the $19,400 zone and the 100 hourly simple moving average. The price is also trading near the 50% Fib retracement level of the downward move from the $20,172 swing high to $18,550 low.
Source: BTCUSD on TradingView.com
On the upside, an immediate resistance is near the $19,400 level and the 100 hourly simple moving average. The next major resistance sits near the $19,500 level. A proper close above the $19,500 resistance might start a steady increase to $20,000. Any more gains might send the price towards the $20,500 resistance zone.
If bitcoin fails to gain pace above the $19,500 zone, it could start another decline. An immediate support on the downside is near the $19,200 zone.
The first major support is now forming near the $19,070 level. A downside break below the $19,070 level might send the price towards the $18,550 support. Any more losses below $18,550 might put a lot of pressure on the bulls. In the stated case, the price could drop towards the $18,000 support in the near term.
Technical indicators:
Hourly MACD – The MACD is now gaining pace in the bullish zone.
Hourly RSI (Relative Strength Index) – The RSI for BTC/USD is now above the 50 level.
Major Support Levels – $19,070, followed by $18,550.
Major Resistance Levels – $19,400, $19,500 and $20,000.
Tags: bitcoinbtcusdBTCUSDTxbtusd
NewsBTCRead More
On-chain data shows a Bitcoin indicator is currently retesting a level that has historically acted…
Bitcoin price started a fresh decline below the $95,000 support. BTC must stay above the…
Bitcoin’s price performance remains under pressure, with the asset experiencing a drop of 2.3% over…
Bitcoin (BTC) continued to slide on Monday, hurt by not just by massive bearish price…
Robert Kiyosaki, a popular author and Bitcoin supporter, is back in the headlines after claiming…
Analysts are currently leaning towards a further breakdown in the Bitcoin price, as market volatility…