TA: Bitcoin Price Gearing For Another Lift-Off to $21K, Recent Breakout Suggests
Bitcoin is gaining pace above the $19,500 resistance against the US Dollar. BTC could rise further above $20,000 if it stays above the $19,000 support.
Bitcoin started a decent increase and was able to clear the $19,500 resistance zone.
The price is trading above $19,000 and the 100 hourly simple moving average.
There was a break above a connecting bearish trend line with resistance near $19,220 on the hourly chart of the BTC/USD pair (data feed from Kraken).
The pair could stage a strong increase if it clears the $20,000 resistance zone.
Bitcoin Price Breaks Hurdle
Bitcoin price remained well bid above the $19,000 support zone. The crypto market was able to recover and BTC climbed higher above the $19,200 resistance zone.
There was a clear move above a connecting bearish trend line with resistance near $19,220 on the hourly chart of the BTC/USD pair. The pair even surpassed a major resistance zone near the $19,500 level to move into a positive zone.
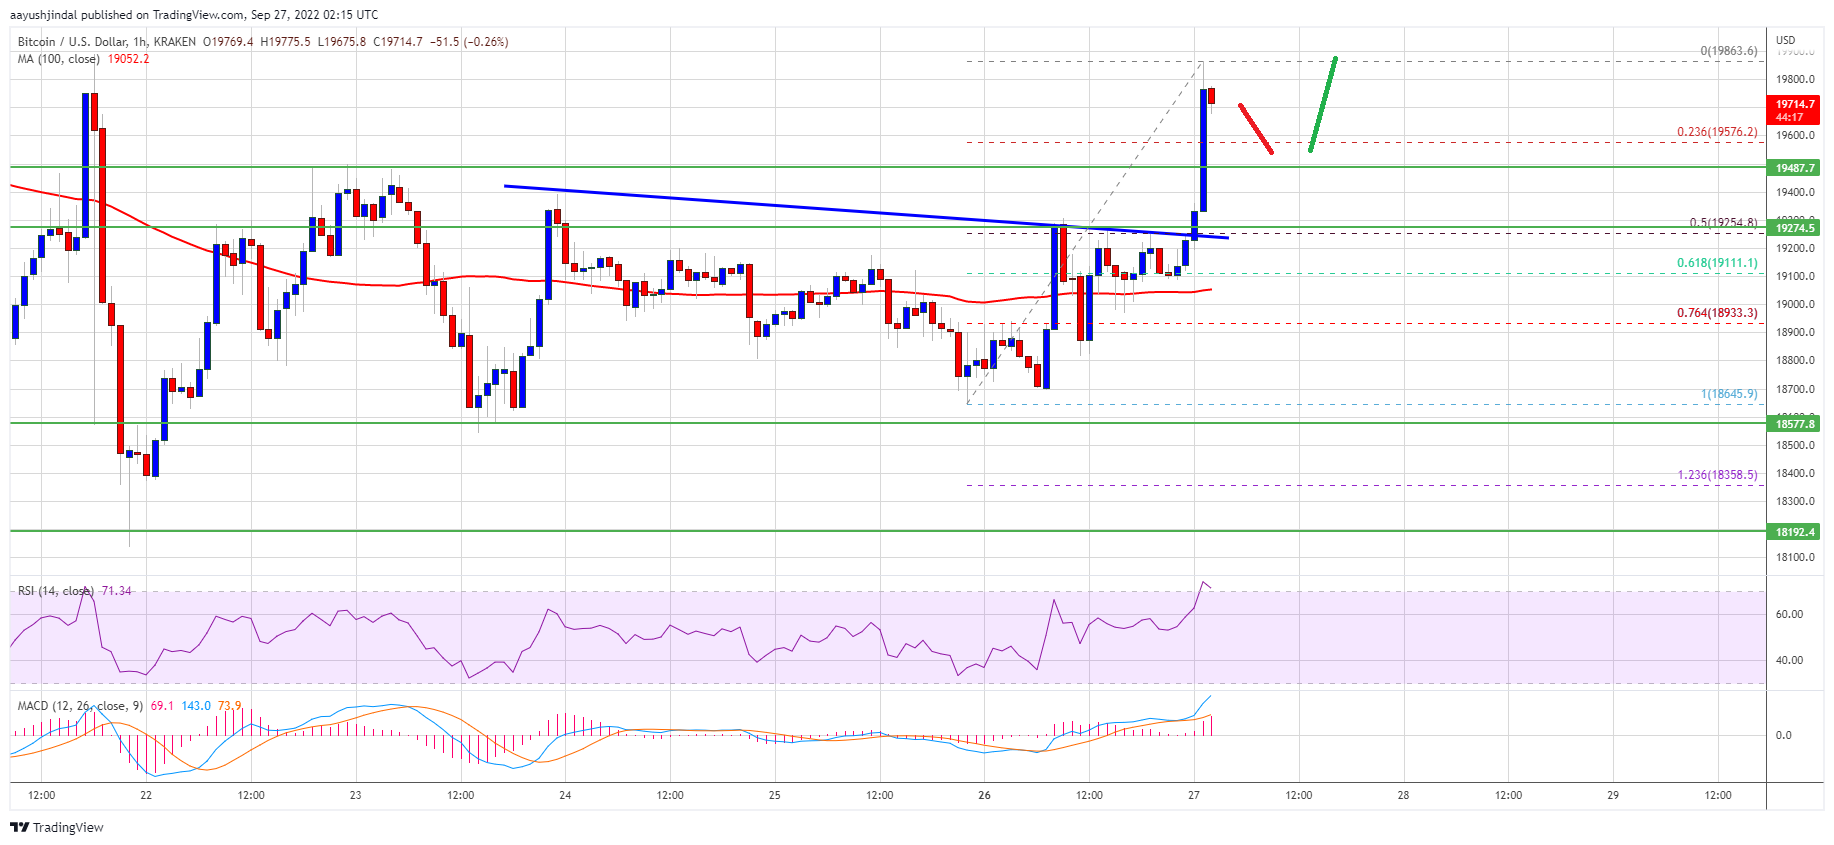
Bitcoin price is now trading above $19,000 and the 100 hourly simple moving average. It traded as high as $19,863 and is currently consolidating gains.
It is trading well above the 23.6% Fib retracement level of the recent increase from the $18,645 swing low to $19,863 high. On the upside, an immediate resistance is near the $19,850 level. The next major resistance sits near the $20,000 zone.
Source: BTCUSD on TradingView.com
A close above the $20,000 level might push the price further into a bullish zone. In the stated case, the price could rise towards $20,500. Any more gains might lead the price higher towards the $21,000 resistance zone.
Dips Supported in BTC?
If bitcoin fails to rise above the $20,000 resistance zone, it could correct lower. An immediate support on the downside is near the $19,550 zone.
The next major support is near the $19,250 zone. It is near the 50% Fib retracement level of the recent increase from the $18,645 swing low to $19,863 high. The main support sits near the $19,000 level, below which the price might move into a bearish zone.
Technical indicators:
Hourly MACD – The MACD is now gaining pace in the bullish zone.
Hourly RSI (Relative Strength Index) – The RSI for BTC/USD is now above the 50 level.
Major Support Levels – $19,550, followed by $19,000.
Major Resistance Levels – $19,850, $20,000 and $20,500.
Bitcoin is gaining pace above the $19,500 resistance against the US Dollar. BTC could rise further above $20,000 if it stays above the $19,000 support.
Bitcoin started a decent increase and was able to clear the $19,500 resistance zone.
The price is trading above $19,000 and the 100 hourly simple moving average.
There was a break above a connecting bearish trend line with resistance near $19,220 on the hourly chart of the BTC/USD pair (data feed from Kraken).
The pair could stage a strong increase if it clears the $20,000 resistance zone.
Bitcoin Price Breaks Hurdle
Bitcoin price remained well bid above the $19,000 support zone. The crypto market was able to recover and BTC climbed higher above the $19,200 resistance zone.
There was a clear move above a connecting bearish trend line with resistance near $19,220 on the hourly chart of the BTC/USD pair. The pair even surpassed a major resistance zone near the $19,500 level to move into a positive zone.
Bitcoin price is now trading above $19,000 and the 100 hourly simple moving average. It traded as high as $19,863 and is currently consolidating gains.
It is trading well above the 23.6% Fib retracement level of the recent increase from the $18,645 swing low to $19,863 high. On the upside, an immediate resistance is near the $19,850 level. The next major resistance sits near the $20,000 zone.
Source: BTCUSD on TradingView.com
A close above the $20,000 level might push the price further into a bullish zone. In the stated case, the price could rise towards $20,500. Any more gains might lead the price higher towards the $21,000 resistance zone.
Dips Supported in BTC?
If bitcoin fails to rise above the $20,000 resistance zone, it could correct lower. An immediate support on the downside is near the $19,550 zone.
The next major support is near the $19,250 zone. It is near the 50% Fib retracement level of the recent increase from the $18,645 swing low to $19,863 high. The main support sits near the $19,000 level, below which the price might move into a bearish zone.
Technical indicators:
Hourly MACD – The MACD is now gaining pace in the bullish zone.
Hourly RSI (Relative Strength Index) – The RSI for BTC/USD is now above the 50 level.
Major Support Levels – $19,550, followed by $19,000.
Major Resistance Levels – $19,850, $20,000 and $20,500.
Tags: bitcoinbtcusdBTCUSDTxbtusd
NewsBTCRead More


Recent Posts
Exodus Hits Record Q1 Revenue As Bitcoin Holdings Rise To 2,011 BTC
Bitcoin Magazine Exodus Hits Record Q1 Revenue As Bitcoin Holdings Rise To 2,011 BTC Exodus…
Bitcoin Price Targets $110,000 All-Time High After Consolidation Trend Ends
Over the past three days, Bitcoin has hovered between $103,000 and $104,500, creating a narrow…
The Blockchain Group Raises €12.1M with Adam Back to Push Bitcoin Strategy
Bitcoin Magazine The Blockchain Group Raises €12.1M with Adam Back to Push Bitcoin Strategy Today,…
The Blockchain Group Raises €22M to Accelerate Its Bitcoin Treasury Strategy
Bitcoin Magazine The Blockchain Group Raises €22M to Accelerate Its Bitcoin Treasury Strategy The Blockchain…
Bitcoin Falls Below $102K; Easing of Tariff Risk Could See More Underperformance
In another addition to the old Wall Street maxim of "buy the rumor, sell the…
Strategy Grows Bitcoin Holdings to $58.5 Billion with Latest $1.34 Billion Purchase
Bitcoin Magazine Strategy Grows Bitcoin Holdings to $58.5 Billion with Latest $1.34 Billion Purchase Strategy…