Bitcoin price gained pace for a move above $20,000 against the US Dollar. BTC is showing positive signs and might rise further above $20,500.
Bitcoin started a steady increase above the $19,200 and $19,500 resistance levels.
The price is trading above $20,000 and the 100 hourly simple moving average.
There is a connecting bullish trend line forming with support near $20,000 on the hourly chart of the BTC/USD pair (data feed from Kraken).
The pair is gaining pace and might rally further above the $20,500 level.
Bitcoin Price Gains Pace
Bitcoin price formed a base above the $19,000 level and started a steady increase. BTC was able to clear the $19,500 and $19,650 resistance levels.
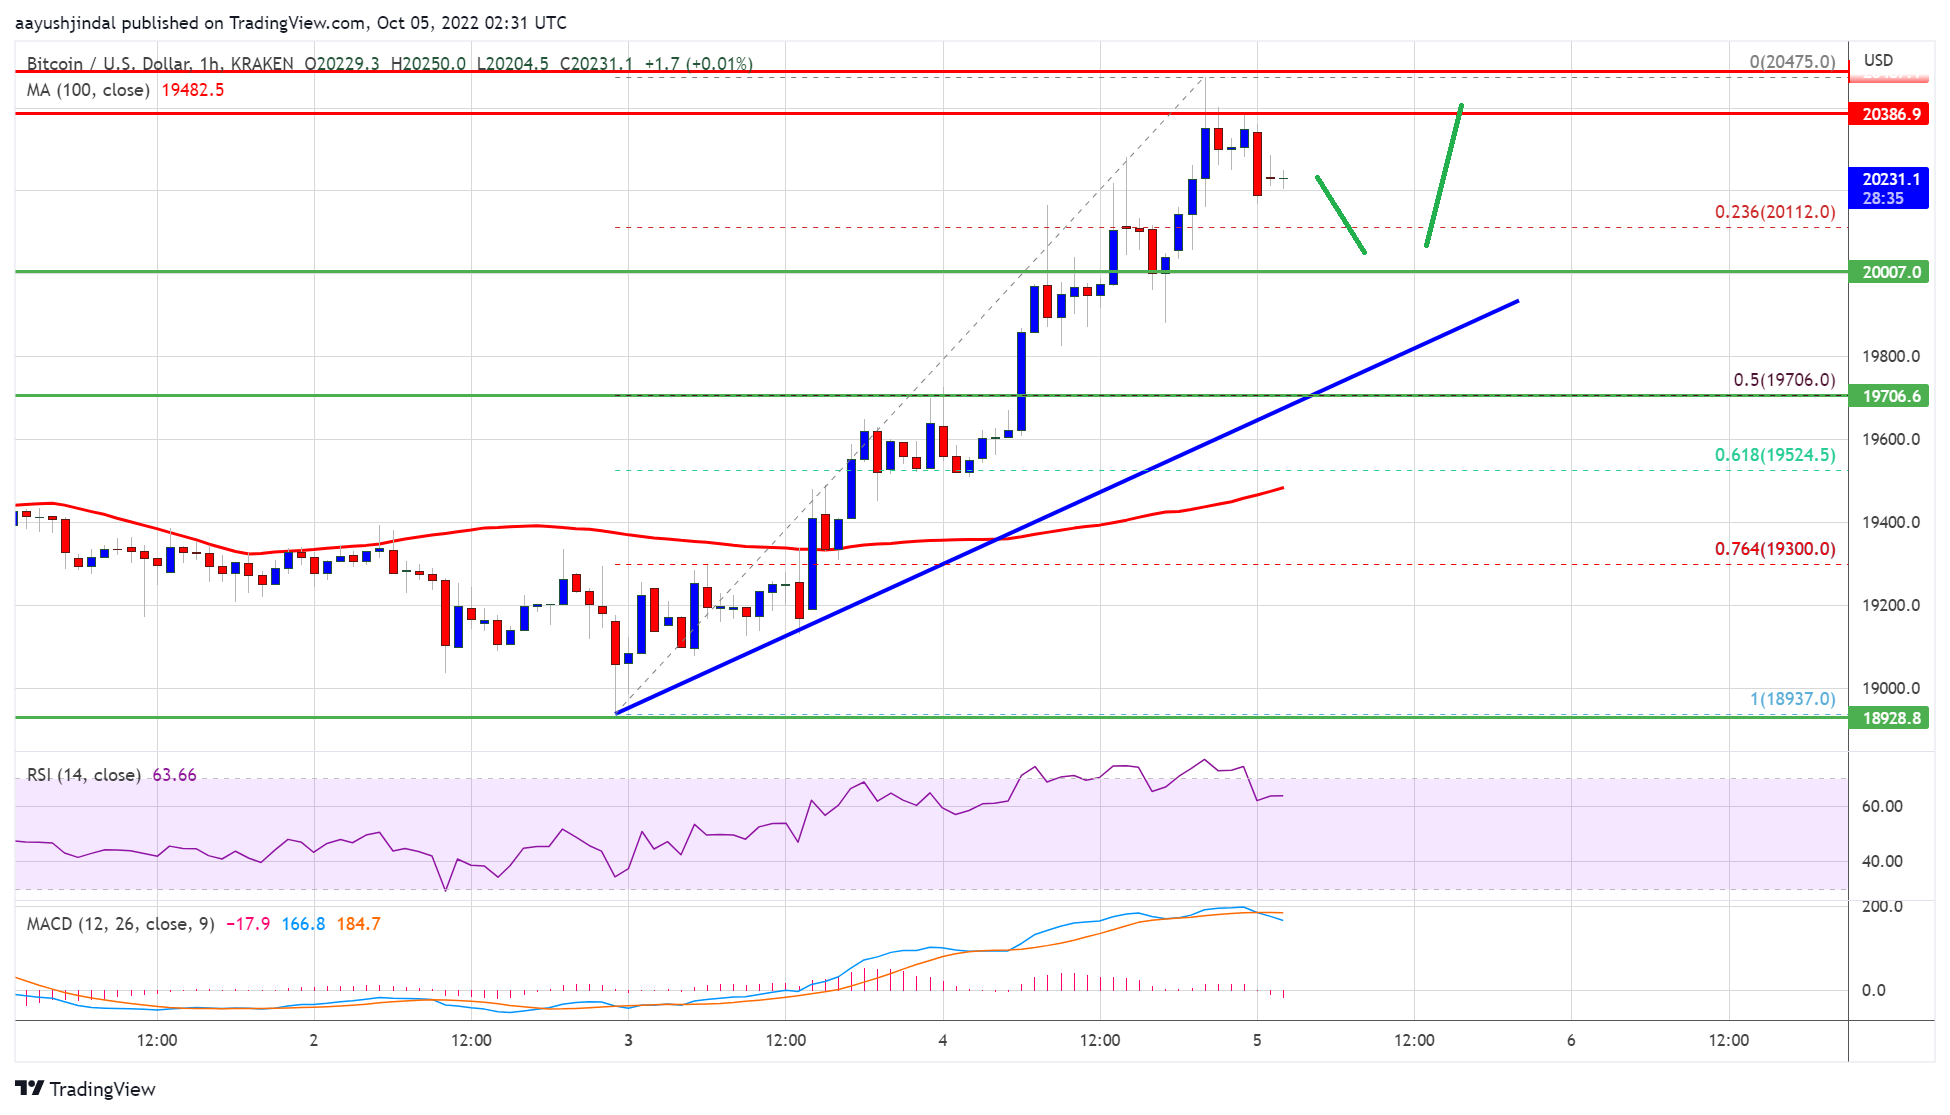
The bulls were able to pump the price above the $20,000 resistance zone. The price traded as high as $20,475 and the price is now correcting gains. It is trading above $20,000 and the 100 hourly simple moving average. Bitcoin is now slowly moving lower below $20,400.
It is trading well above the 23.6% Fib retracement level of the upward move from the $18,937 swing low to $20,475 high. There is also a connecting bullish trend line forming with support near $20,000 on the hourly chart of the BTC/USD pair.
Source: BTCUSD on TradingView.com
On the upside, an immediate resistance is near the $20,450 level. The next major resistance sits near the $20,500 zone. A clear move above the $20,500 resistance might start another increase. In the stated case, the price could even surpass the $21,200 resistance zone. The next major resistance is near the $22,500 zone.
Dips Limited in BTC?
If bitcoin fails to rise above the $20,500 resistance zone, it could start a downside correction. An immediate support on the downside is near the $20,100 zone.
The next major support is near the $20,000 zone and the trend line. A downside break below the trend line might send the price towards $19,700. It is near the 50% Fib retracement level of the upward move from the $18,937 swing low to $20,475 high. The main support is near $19,500, below which the price might drop to $19,200.
Technical indicators:
Hourly MACD – The MACD is now gaining pace in the bullish zone.
Hourly RSI (Relative Strength Index) – The RSI for BTC/USD is now above the 50 level.
Major Support Levels – $20,100, followed by $20,000.
Major Resistance Levels – $20,500, $21,200 and $22,500.
Bitcoin price gained pace for a move above $20,000 against the US Dollar. BTC is showing positive signs and might rise further above $20,500.
Bitcoin started a steady increase above the $19,200 and $19,500 resistance levels.
The price is trading above $20,000 and the 100 hourly simple moving average.
There is a connecting bullish trend line forming with support near $20,000 on the hourly chart of the BTC/USD pair (data feed from Kraken).
The pair is gaining pace and might rally further above the $20,500 level.
Bitcoin price formed a base above the $19,000 level and started a steady increase. BTC was able to clear the $19,500 and $19,650 resistance levels.
The bulls were able to pump the price above the $20,000 resistance zone. The price traded as high as $20,475 and the price is now correcting gains. It is trading above $20,000 and the 100 hourly simple moving average. Bitcoin is now slowly moving lower below $20,400.
It is trading well above the 23.6% Fib retracement level of the upward move from the $18,937 swing low to $20,475 high. There is also a connecting bullish trend line forming with support near $20,000 on the hourly chart of the BTC/USD pair.
Source: BTCUSD on TradingView.com
On the upside, an immediate resistance is near the $20,450 level. The next major resistance sits near the $20,500 zone. A clear move above the $20,500 resistance might start another increase. In the stated case, the price could even surpass the $21,200 resistance zone. The next major resistance is near the $22,500 zone.
If bitcoin fails to rise above the $20,500 resistance zone, it could start a downside correction. An immediate support on the downside is near the $20,100 zone.
The next major support is near the $20,000 zone and the trend line. A downside break below the trend line might send the price towards $19,700. It is near the 50% Fib retracement level of the upward move from the $18,937 swing low to $20,475 high. The main support is near $19,500, below which the price might drop to $19,200.
Technical indicators:
Hourly MACD – The MACD is now gaining pace in the bullish zone.
Hourly RSI (Relative Strength Index) – The RSI for BTC/USD is now above the 50 level.
Major Support Levels – $20,100, followed by $20,000.
Major Resistance Levels – $20,500, $21,200 and $22,500.
Tags: bitcoinbtcusdBTCUSDTxbtusd
NewsBTCRead More
Ethereum's ether (ETH) showed strength through the weekend, spurring investor hopes of a break in…
A fresh infusion of liquidity from the US Treasury General Account (TGA) is making waves…
Bitcoin has been stuck for the last three months, trading between $90K and $100K. It…
Litecoin has been gaining momentum in recent weeks, and according to crypto analyst Tony “The…
Bitcoin (BTC) miners listed in the U.S. are growing their share of the network hashrate,…
Metaplanet (3350) said it bought a further 269.43 bitcoin (BTC), strengthening its position as a…