TA: Bitcoin Price Resilience Suggests A Fresh Rally is Imminent: Here’s Why
Bitcoin found a strong buying interest near $18,500 against the US Dollar. BTC is recovering and there could be a fresh increase above the $20,000 resistance.
Bitcoin remained stable and the bulls again protected the $18,500 support zone.
The price is trading above $19,000 and the 100 hourly simple moving average.
There is a short-term channel forming with support near $19,280 on the hourly chart of the BTC/USD pair (data feed from Kraken).
The pair could start a fresh rally if there is a clear move above the $19,650 resistance zone.
Bitcoin Price Holds Key Support
Bitcoin price declined heavily from well above the $20,000 pivot level. BTC dropped below the $19,000 level, but the bulls were active near the $18,500 support zone.
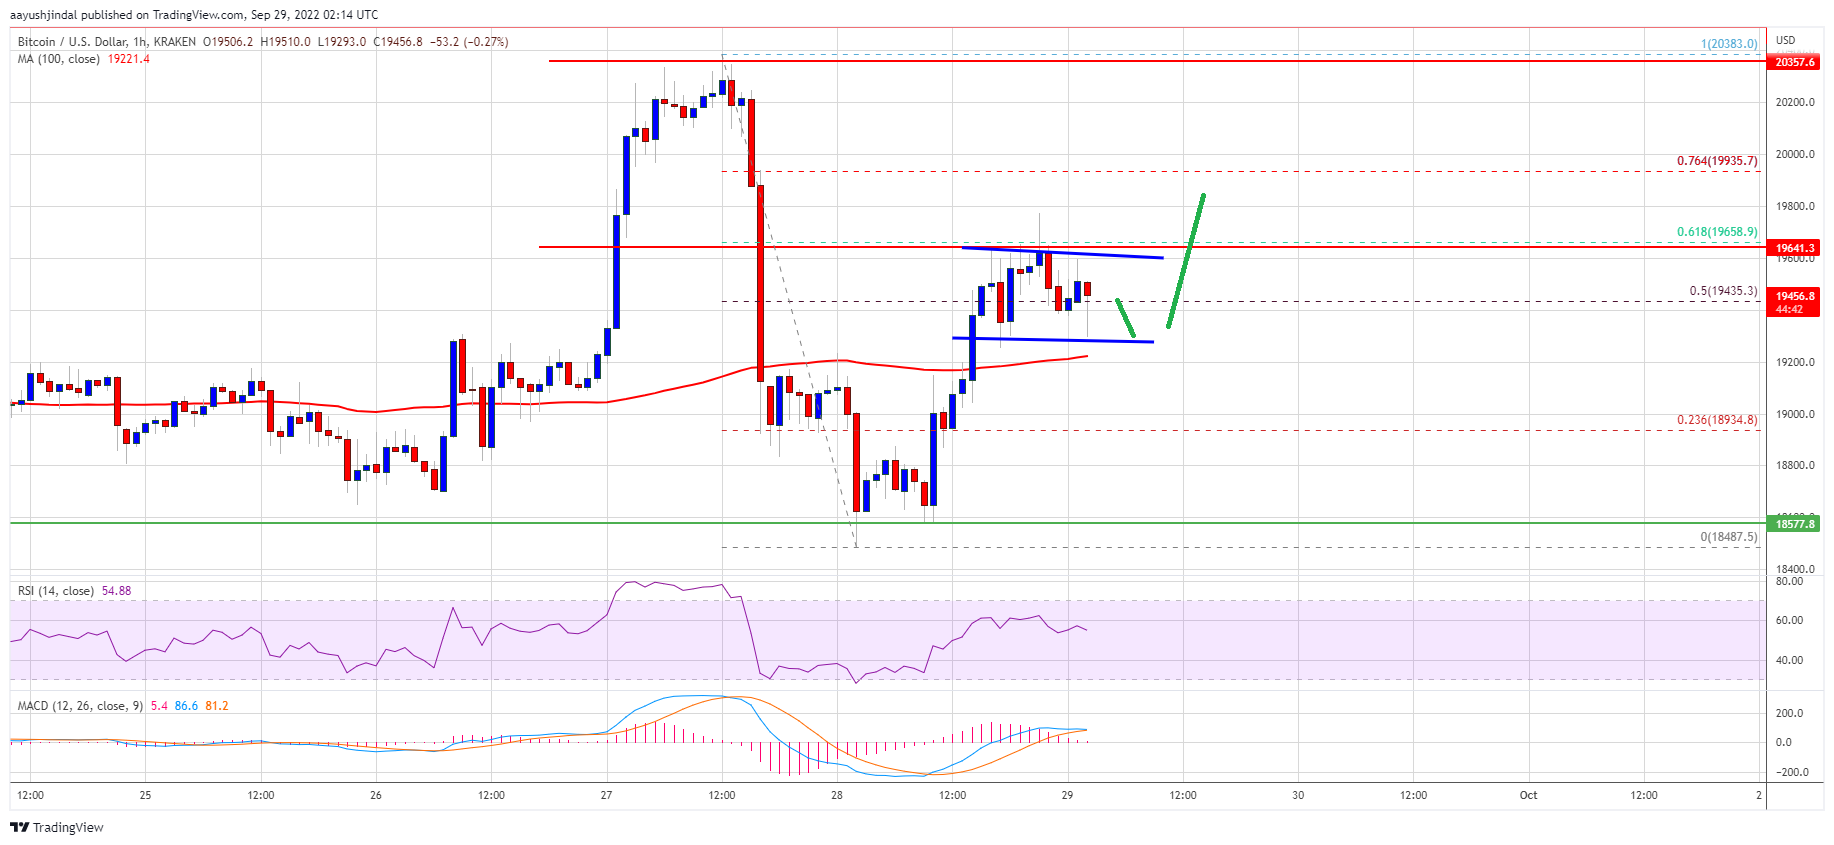
It seems like the price is well supported near the $18,500 zone and there are multiple rejections visible around the same area. The price is now rising and there was a move above the $19,000 resistance zone. The bulls pushed the price above the 50% Fib retracement level of the downward move from the $20,383 swing high to $18,487 low.
Bitcoin price is now trading above $19,000 and the 100 hourly simple moving average. There is also a short-term channel forming with support near $19,280 on the hourly chart of the BTC/USD pair.
On the upside, an immediate resistance is near the $19,600 level. The next major resistance sits near the $19,650 zone. It is close to the 61.8% Fib retracement level of the downward move from the $20,383 swing high to $18,487 low.
Source: BTCUSD on TradingView.com
A close above the $19,650 level might start a fresh increase. In the stated case, the price could rise towards $20,000. Any more gains might lead the price higher towards the $20,500 resistance zone.
Another Decline in BTC?
If bitcoin fails to recover above the $19,650 resistance zone, it could start a fresh decline. An immediate support on the downside is near the $19,280 zone and the channel trend line.
The next major support is near the $19,200 zone and the 100 hourly SMA. The main support is near $19,000. Any more losses might call for a drop towards the $18,500 support zone in the coming sessions.
Technical indicators:
Hourly MACD – The MACD is now losing pace in the bullish zone.
Hourly RSI (Relative Strength Index) – The RSI for BTC/USD is now above the 50 level.
Major Support Levels – $19,200, followed by $19,000.
Major Resistance Levels – $19,650, $20,000 and $20,500.
Bitcoin found a strong buying interest near $18,500 against the US Dollar. BTC is recovering and there could be a fresh increase above the $20,000 resistance.
Bitcoin remained stable and the bulls again protected the $18,500 support zone.
The price is trading above $19,000 and the 100 hourly simple moving average.
There is a short-term channel forming with support near $19,280 on the hourly chart of the BTC/USD pair (data feed from Kraken).
The pair could start a fresh rally if there is a clear move above the $19,650 resistance zone.
Bitcoin Price Holds Key Support
Bitcoin price declined heavily from well above the $20,000 pivot level. BTC dropped below the $19,000 level, but the bulls were active near the $18,500 support zone.
It seems like the price is well supported near the $18,500 zone and there are multiple rejections visible around the same area. The price is now rising and there was a move above the $19,000 resistance zone. The bulls pushed the price above the 50% Fib retracement level of the downward move from the $20,383 swing high to $18,487 low.
Bitcoin price is now trading above $19,000 and the 100 hourly simple moving average. There is also a short-term channel forming with support near $19,280 on the hourly chart of the BTC/USD pair.
On the upside, an immediate resistance is near the $19,600 level. The next major resistance sits near the $19,650 zone. It is close to the 61.8% Fib retracement level of the downward move from the $20,383 swing high to $18,487 low.
Source: BTCUSD on TradingView.com
A close above the $19,650 level might start a fresh increase. In the stated case, the price could rise towards $20,000. Any more gains might lead the price higher towards the $20,500 resistance zone.
Another Decline in BTC?
If bitcoin fails to recover above the $19,650 resistance zone, it could start a fresh decline. An immediate support on the downside is near the $19,280 zone and the channel trend line.
The next major support is near the $19,200 zone and the 100 hourly SMA. The main support is near $19,000. Any more losses might call for a drop towards the $18,500 support zone in the coming sessions.
Technical indicators:
Hourly MACD – The MACD is now losing pace in the bullish zone.
Hourly RSI (Relative Strength Index) – The RSI for BTC/USD is now above the 50 level.
Major Support Levels – $19,200, followed by $19,000.
Major Resistance Levels – $19,650, $20,000 and $20,500.
Tags: bitcoinbtcusdBTCUSDTxbtusd
NewsBTCRead More


Recent Posts
Bull Market Reignited? Analyst Says Bitcoin Rally Mirrors June 2020 Setup
Bitcoin’s recent surge has kept its price firmly above the $100,000 price level, reflecting ongoing…
Bitcoin Market Cycle Indicator Hints At Bullish Breakout Ahead, Analyst Says
According to a recent CryptoQuant Quicktake post by contributor burakkemeci, Bitcoin (BTC) is beginning to…
Bitcoin Reaches $103K as Funding Rate Turns Positive Post-Liquidations
Bitcoin has revisited the $100,000 mark for the first time in months, gaining nearly 5%…
New Bitcoin Whales Sitting On 185% Higher Cost Basis Than HODLer Whales, Data Shows
On-chain data shows the Bitcoin short-term holder whales have recently been entering at three times…
Tech Expert Predicts $1 Million Bitcoin — ‘Only One More 10x Left’
Bitcoin was back in the news this week after surging past $104,000 before retracting a…
Bitcoin Whale Entry Prices Diverge Sharply – Confidence Builds At Higher Levels
Bitcoin has surged to $104,300, confirming the uptrend and reinforcing the bullish outlook that many…