TA: Bitcoin Price Restarts Increase After Fed Rate Hike But Resistance Intact
Bitcoin started a fresh increase above the $22,000 resistance zone against the US Dollar. BTC must clear $23,000 and $23,700 to continue higher.
Bitcoin started a fresh increase after the fed hiked interest rates by 75bps.
The price is now trading above the $22,500 level and the 100 hourly simple moving average.
There was a break above a major bearish trend line with resistance near $21,800 on the hourly chart of the BTC/USD pair (data feed from Kraken).
The pair must clear the $23,000 barrier to continue higher in the near term.
Bitcoin Price Starts Fresh Increase
Bitcoin price stayed above the $21,000 support zone. It formed a base above the $21,000 level and started a fresh increase. The recent fed interest rate hike triggered a sharp upward move above the $22,000 resistance.
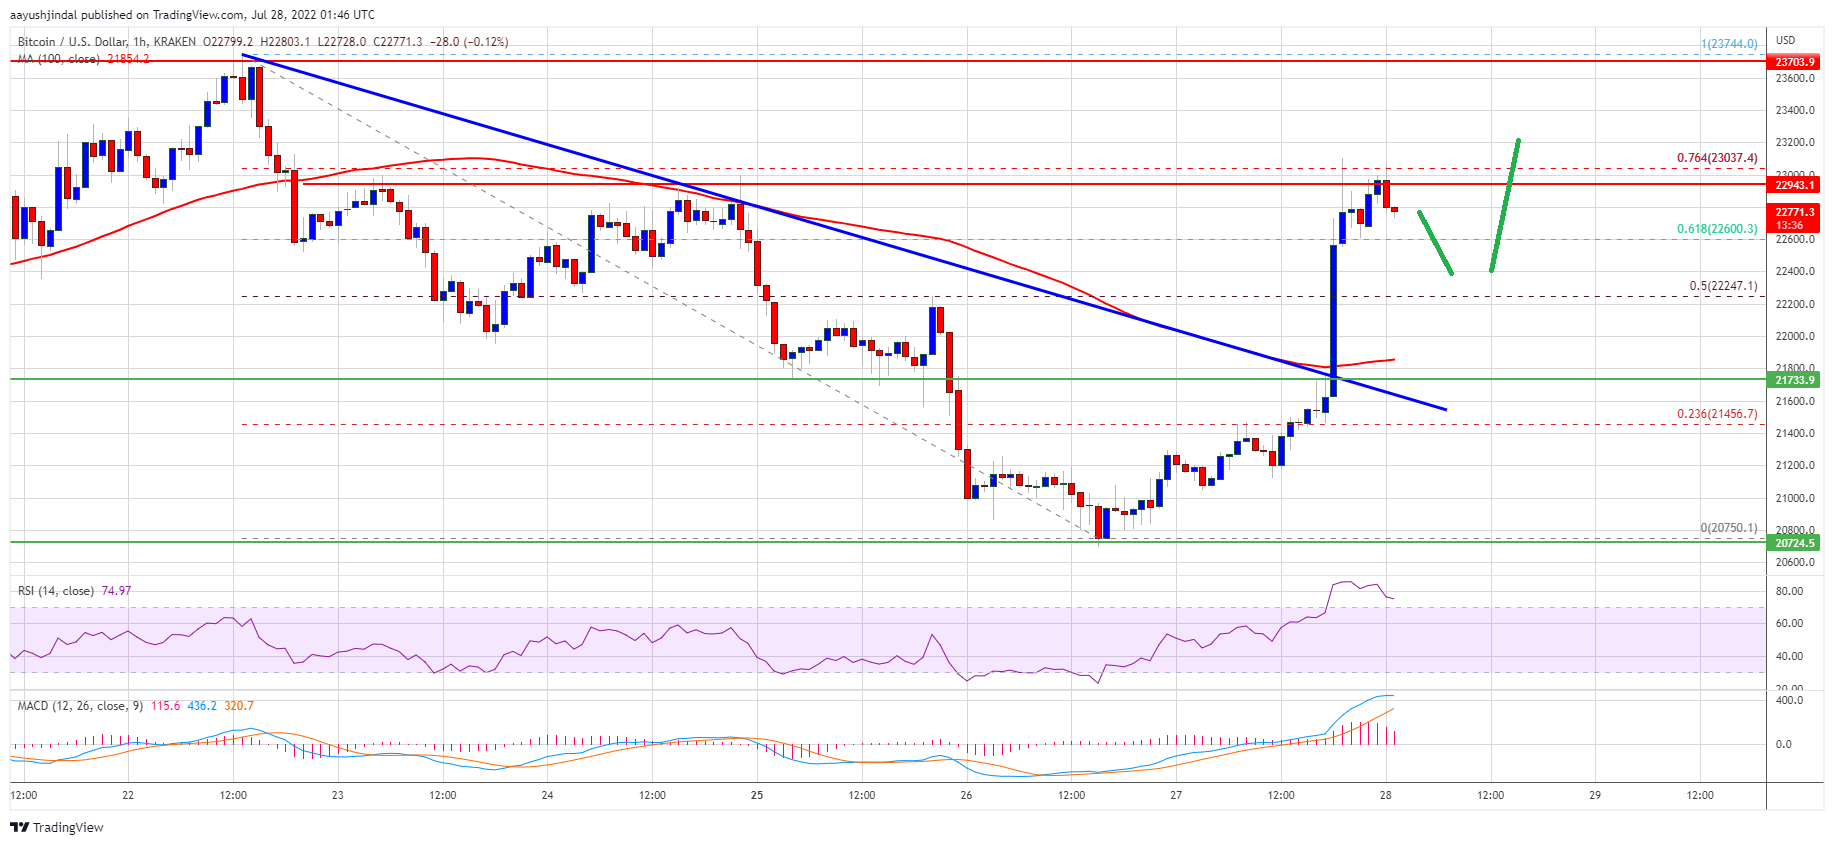
The price was able to clear the 50% Fib retracement level of the key drop from the $23,744 swing high to $20,750 low. Besides, there was a break above a major bearish trend line with resistance near $21,800 on the hourly chart of the BTC/USD pair.
Bitcoin price is now trading above the $22,500 level and the 100 hourly simple moving average. It seems like the price is facing a strong resistance near the $23,000 zone.
Source: BTCUSD on TradingView.com
The 76.4% Fib retracement level of the key drop from the $23,744 swing high to $20,750 low is also acting as a resistance. The next key resistance is near the $23,750 zone. A close above the $23,750 resistance zone could set the pace for a strong increase. In the stated case, the price may perhaps rise towards the $24,500 level. The next major resistance sits near the $25,000 level.
More Losses in BTC?
If bitcoin fails to clear the $23,000 resistance zone, it could start a downside correction. An immediate support on the downside is near the $22,500 level.
The next major support now sits near the $22,150 and $22,000 levels. A close below the $22,000 support zone might restart downtrend. In the stated case, the price might revisit the $21,000 support in the near term.
Technical indicators:
Hourly MACD – The MACD is now losing pace in the bullish zone.
Hourly RSI (Relative Strength Index) – The RSI for BTC/USD is now in the overbought zone.
Major Support Levels – $22,500, followed by $22,000.
Major Resistance Levels – $23,000, $23,550 and $23,750.
Bitcoin started a fresh increase above the $22,000 resistance zone against the US Dollar. BTC must clear $23,000 and $23,700 to continue higher.
Bitcoin started a fresh increase after the fed hiked interest rates by 75bps.
The price is now trading above the $22,500 level and the 100 hourly simple moving average.
There was a break above a major bearish trend line with resistance near $21,800 on the hourly chart of the BTC/USD pair (data feed from Kraken).
The pair must clear the $23,000 barrier to continue higher in the near term.
Bitcoin Price Starts Fresh Increase
Bitcoin price stayed above the $21,000 support zone. It formed a base above the $21,000 level and started a fresh increase. The recent fed interest rate hike triggered a sharp upward move above the $22,000 resistance.
The price was able to clear the 50% Fib retracement level of the key drop from the $23,744 swing high to $20,750 low. Besides, there was a break above a major bearish trend line with resistance near $21,800 on the hourly chart of the BTC/USD pair.
Bitcoin price is now trading above the $22,500 level and the 100 hourly simple moving average. It seems like the price is facing a strong resistance near the $23,000 zone.
Source: BTCUSD on TradingView.com
The 76.4% Fib retracement level of the key drop from the $23,744 swing high to $20,750 low is also acting as a resistance. The next key resistance is near the $23,750 zone. A close above the $23,750 resistance zone could set the pace for a strong increase. In the stated case, the price may perhaps rise towards the $24,500 level. The next major resistance sits near the $25,000 level.
More Losses in BTC?
If bitcoin fails to clear the $23,000 resistance zone, it could start a downside correction. An immediate support on the downside is near the $22,500 level.
The next major support now sits near the $22,150 and $22,000 levels. A close below the $22,000 support zone might restart downtrend. In the stated case, the price might revisit the $21,000 support in the near term.
Technical indicators:
Hourly MACD – The MACD is now losing pace in the bullish zone.
Hourly RSI (Relative Strength Index) – The RSI for BTC/USD is now in the overbought zone.
Major Support Levels – $22,500, followed by $22,000.
Major Resistance Levels – $23,000, $23,550 and $23,750.
Tags: bitcoinbtcusdBTCUSDTxbtusd
NewsBTCRead More


Recent Posts
Is Bitcoin Headed For A New ATH After $104,000 Triumph? What This Market Expert Thinks
Since reaching a local bottom of $74,000 in mid-April, Bitcoin has seen a market rebound,…
Best Crypto to Buy Now as UFC Legend Conor McGregor Calls for a Bitcoin Strategic Reserve in Ireland
‘Victory to Ireland’ is how Connor McGregor signed off on an emphatic call for a…
Taiwan Official Proposes Bitcoin As Part Of National Reserve Strategy
A Taiwanese politician urged the government Friday to include Bitcoin in its reserve composition. He…
Analysis: Coinbase Is Buying Bitcoin, Just Don’t Call It a Treasury Strategy.
Coinbase (COIN) has its own strategy for BTC on the corporate balance sheet, but it's…
Bitcoin 4H Chart Shows Bullish Consolidation – Classic Continuation?
Bitcoin is trading confidently above the $100,000 mark, having recently marked a local high near…
Dogecoin Surges 10%, Bitcoin Nears $104K Amid Renewed ‘Risk-on’ Sentiment
Bitcoin pushed past the six-figure mark for the first time in over two months, coming…