TA: Bitcoin Price Showing Early Signs of Fresh Downtrend, But $22.5K Is The Key
Bitcoin declined further below the $23,000 level against the US Dollar. BTC is moving lower and remains at a risk of more losses if it breaks the $22,000 support.
Bitcoin extended losses and declined below the $23,200 support.
The price is now trading below the $23,500 level and the 100 hourly simple moving average.
There is a key bearish trend line forming with resistance near $23,550 on the hourly chart of the BTC/USD pair (data feed from Kraken).
The pair could extend losses if there is a clear move below the $22,500 support in the near term.
Bitcoin Price Gains Bearish Momentum
Bitcoin price settled below the $24,000 level to move into a bearish zone. BTC gained bearish momentum below the $23,500 and $23,200 support levels.
It opened the doors for more losses below the $23,000 level and the 100 hourly simple moving average. Finally, the price found support near the $22,700 zone. A low was formed near $22,715 and the price is now consolidating losses.
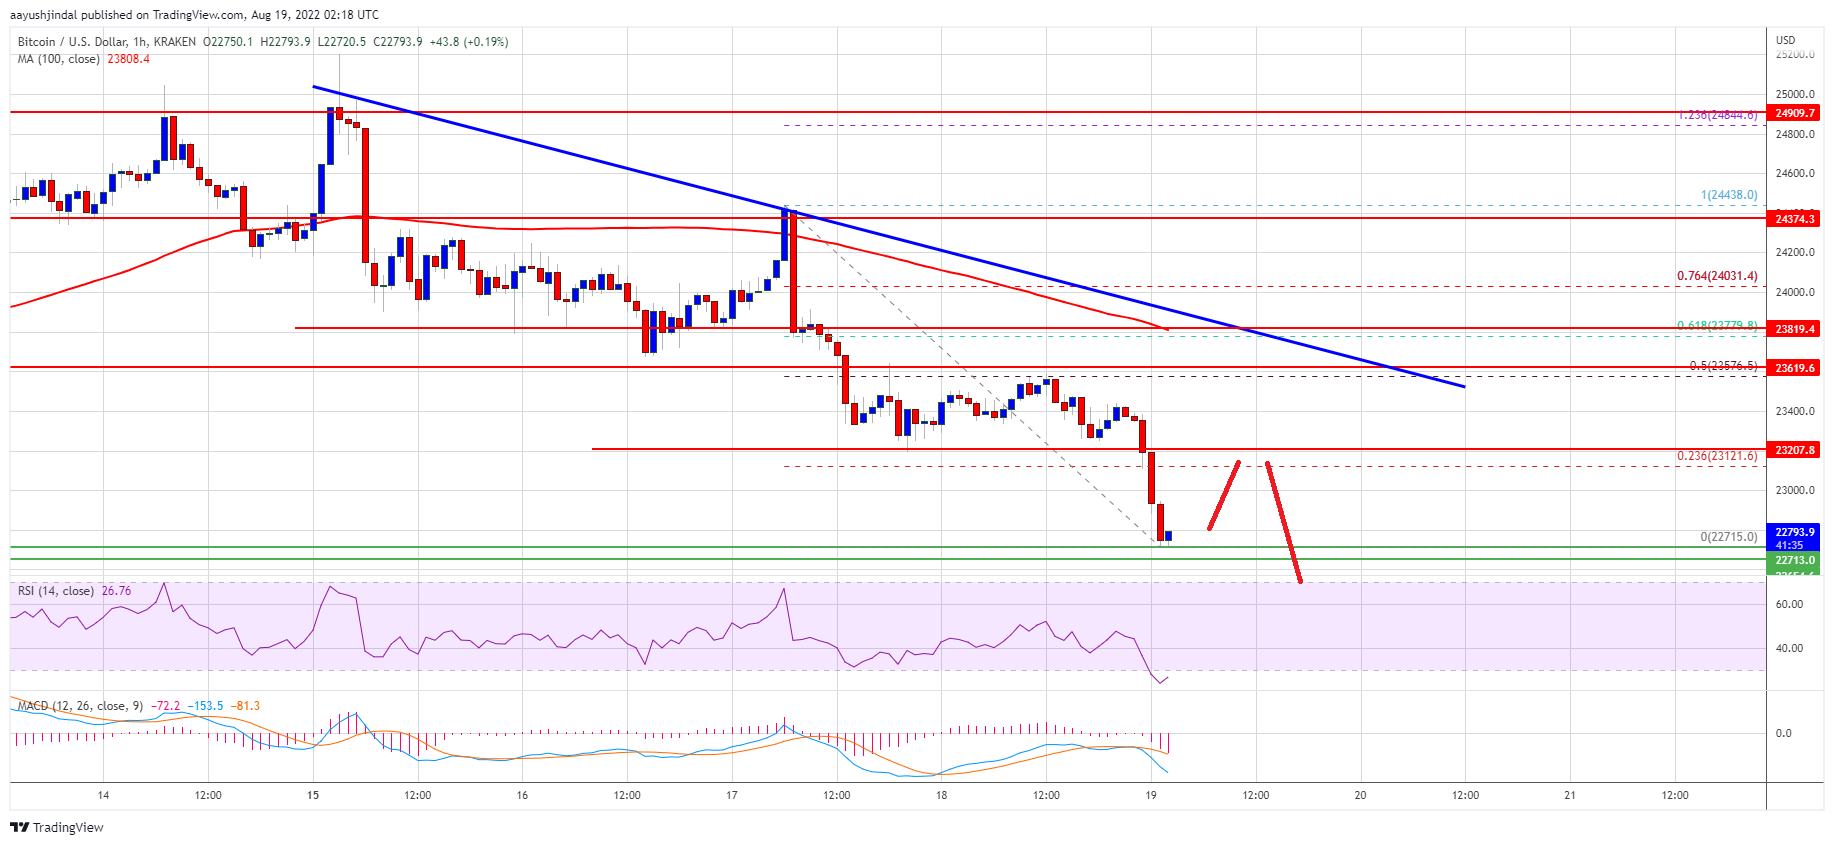
Bitcoin price is now trading below the $23,200 level and the 100 hourly simple moving average. On the upside, an immediate resistance is near the $23,150 level. It is near the 23.6% Fib retracement level of the key drop from the $24,440 swing high to $22,715 low.
The first major resistance on the upside sits near the $23,550 level. It is near the 50% Fib retracement level of the key drop from the $24,440 swing high to $22,715 low.
Source: BTCUSD on TradingView.com
There is also a key bearish trend line forming with resistance near $23,550 on the hourly chart of the BTC/USD pair. The main resistance is forming near the $23,750 zone and the 100 hourly simple moving average. A close above the $23,550 and $23,800 resistance levels might start another increase.
In the stated case, the price may perhaps climb above the $24,000 resistance. Any more gains might send the price towards the $24,500 level.
More Losses in BTC?
If bitcoin fails to clear the $23,200 resistance zone, it could continue to move down. An immediate support on the downside is near the $22,715 level.
The next major support now sits near the $22,500 level. A downside break and close below the $22,500 level might could push the price further into a bearish zone. In the stated case, the price might decline towards the $21,200 level.
Technical indicators:
Hourly MACD – The MACD is now gaining pace in the bearish zone.
Hourly RSI (Relative Strength Index) – The RSI for BTC/USD is now below the 50 level.
Major Support Levels – $22,715, followed by $22,500.
Major Resistance Levels – $23,200, $23,550 and $23,800.
Bitcoin declined further below the $23,000 level against the US Dollar. BTC is moving lower and remains at a risk of more losses if it breaks the $22,000 support.
Bitcoin extended losses and declined below the $23,200 support.
The price is now trading below the $23,500 level and the 100 hourly simple moving average.
There is a key bearish trend line forming with resistance near $23,550 on the hourly chart of the BTC/USD pair (data feed from Kraken).
The pair could extend losses if there is a clear move below the $22,500 support in the near term.
Bitcoin Price Gains Bearish Momentum
Bitcoin price settled below the $24,000 level to move into a bearish zone. BTC gained bearish momentum below the $23,500 and $23,200 support levels.
It opened the doors for more losses below the $23,000 level and the 100 hourly simple moving average. Finally, the price found support near the $22,700 zone. A low was formed near $22,715 and the price is now consolidating losses.
Bitcoin price is now trading below the $23,200 level and the 100 hourly simple moving average. On the upside, an immediate resistance is near the $23,150 level. It is near the 23.6% Fib retracement level of the key drop from the $24,440 swing high to $22,715 low.
The first major resistance on the upside sits near the $23,550 level. It is near the 50% Fib retracement level of the key drop from the $24,440 swing high to $22,715 low.
Source: BTCUSD on TradingView.com
There is also a key bearish trend line forming with resistance near $23,550 on the hourly chart of the BTC/USD pair. The main resistance is forming near the $23,750 zone and the 100 hourly simple moving average. A close above the $23,550 and $23,800 resistance levels might start another increase.
In the stated case, the price may perhaps climb above the $24,000 resistance. Any more gains might send the price towards the $24,500 level.
More Losses in BTC?
If bitcoin fails to clear the $23,200 resistance zone, it could continue to move down. An immediate support on the downside is near the $22,715 level.
The next major support now sits near the $22,500 level. A downside break and close below the $22,500 level might could push the price further into a bearish zone. In the stated case, the price might decline towards the $21,200 level.
Technical indicators:
Hourly MACD – The MACD is now gaining pace in the bearish zone.
Hourly RSI (Relative Strength Index) – The RSI for BTC/USD is now below the 50 level.
Major Support Levels – $22,715, followed by $22,500.
Major Resistance Levels – $23,200, $23,550 and $23,800.
Tags: bitcoinbtcusdBTCUSDTxbtusd
NewsBTCRead More


Recent Posts
Strive Reveals New Bitcoin Treasury Blueprint at Strategy World 2025
Bitcoin Magazine Strive Reveals New Bitcoin Treasury Blueprint at Strategy World 2025 A new kind…
Dogecoin, Cardano’s ADA Lead Market Gains as Bitcoin Traders Eye Next Fed Meeting
Bitcoin (BTC) flirted with $100,000 Thursday as major cryptocurrencies including dogecoin (DOGE) and Cardano’s ADA…
Bitcoin’s Realized Cap Hits Record High as Accumulation Continues
Bitcoin is currently trading just under the $100,000 psychological threshold, maintaining a sideways trajectory in…
What’s Next for Bitcoin With Crypto Market Cheering Trump’s Trade Deal Hype?
Bitcoin (BTC) is fast closing on the $100,000 mark as U.S. President Donald Trump teased…
Arthur Hayes Says Bitcoin Will Hit $1M by 2028 as U.S.-China Craft Hollow Trade Deal
Arthur Hayes has a message for crypto investors and bitcoin (BTC) HODLers obsessing over Federal…
Bitcoin Nears $100K as Trump Teases ‘Big’ Trade Deal
Bitcoin zoomed close to $100,000 early Thursday as President Donald Trump said a tariff deal…