TA: Bitcoin Price Signals Bearish Reaction, Why BTC Could Revisit $22K
Bitcoin is showing a few bearish signs below the $24,000 resistance zone against the US Dollar. BTC is declining and might test the $22,000 support zone.
Bitcoin is slowly moving lower below the $24,000 pivot level.
The price is now trading below the $23,500 level and the 100 hourly simple moving average.
There is a key bearish trend line forming with resistance near $23,300 on the hourly chart of the BTC/USD pair (data feed from Kraken).
The pair could continue to move down towards the $22,000 support in the near term.
Bitcoin Price Starts Decrease
Bitcoin price failed to start a fresh increase above the $24,000 resistance zone. The price started a fresh decline and settled below the $23,500 support zone.
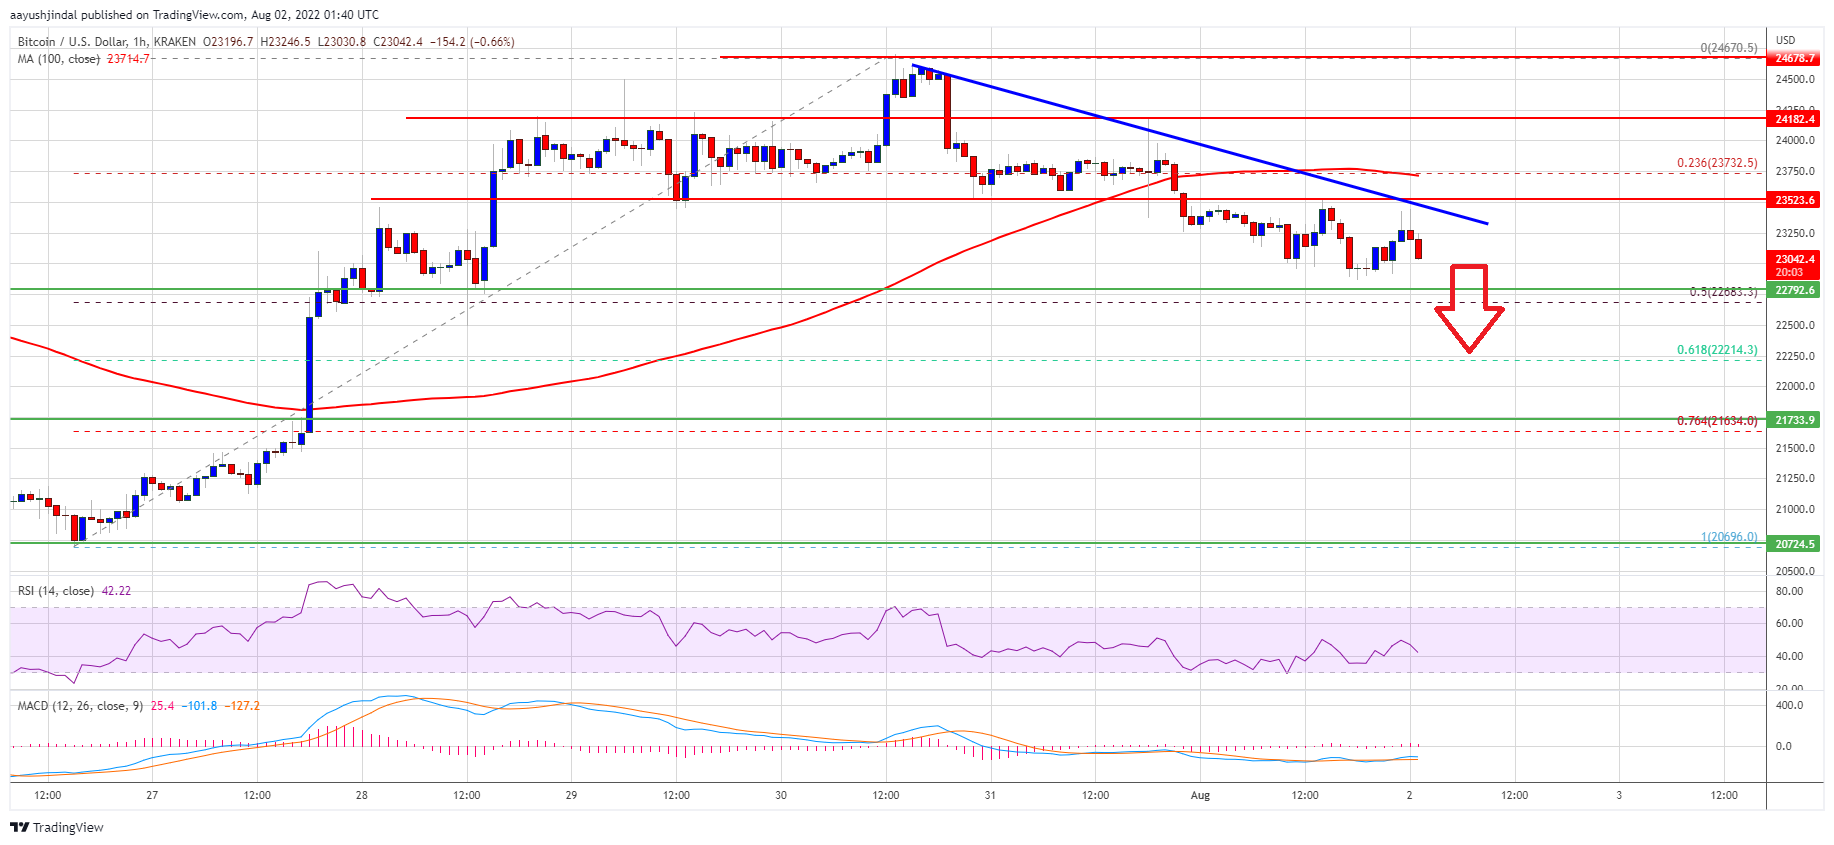
There was a clear move below the 23.6% Fib retracement level of the upward move from the $20,695 swing low to $24,670 high. The price is now showing bearish signs below the $23,500 level and the 100 hourly simple moving average.
There is also a key bearish trend line forming with resistance near $23,300 on the hourly chart of the BTC/USD pair. The current price action suggests bitcoin could continue to move down, with an immediate support at $22,800.
On the upside, the price is facing resistance near the $23,300 level and the trend line. The next key resistance is near the $23,750 zone and the 100 hourly simple moving average.
Source: BTCUSD on TradingView.com
The main resistance could be near the $24,000 zone. A close above the $24,000 resistance zone could set the pace for a fresh increase. In the stated case, the price may perhaps rise towards the $24,500 level. The next major resistance sits near the $25,000 level.
More Losses in BTC?
If bitcoin fails to clear the $23,300 resistance zone, it could continue to move down. An immediate support on the downside is near the $22,800 level.
The next major support now sits near the $22,680 level. It is near the 50% Fib retracement level of the upward move from the $20,695 swing low to $24,670 high. Any more losses might send the price towards $22,000 level.
Technical indicators:
Hourly MACD – The MACD is now gaining pace in the bearish zone.
Hourly RSI (Relative Strength Index) – The RSI for BTC/USD is now below the 50 level.
Major Support Levels – $22,680, followed by $22,000.
Major Resistance Levels – $23,300, $23,750 and $24,000.
Bitcoin is showing a few bearish signs below the $24,000 resistance zone against the US Dollar. BTC is declining and might test the $22,000 support zone.
Bitcoin is slowly moving lower below the $24,000 pivot level.
The price is now trading below the $23,500 level and the 100 hourly simple moving average.
There is a key bearish trend line forming with resistance near $23,300 on the hourly chart of the BTC/USD pair (data feed from Kraken).
The pair could continue to move down towards the $22,000 support in the near term.
Bitcoin Price Starts Decrease
Bitcoin price failed to start a fresh increase above the $24,000 resistance zone. The price started a fresh decline and settled below the $23,500 support zone.
There was a clear move below the 23.6% Fib retracement level of the upward move from the $20,695 swing low to $24,670 high. The price is now showing bearish signs below the $23,500 level and the 100 hourly simple moving average.
There is also a key bearish trend line forming with resistance near $23,300 on the hourly chart of the BTC/USD pair. The current price action suggests bitcoin could continue to move down, with an immediate support at $22,800.
On the upside, the price is facing resistance near the $23,300 level and the trend line. The next key resistance is near the $23,750 zone and the 100 hourly simple moving average.
Source: BTCUSD on TradingView.com
The main resistance could be near the $24,000 zone. A close above the $24,000 resistance zone could set the pace for a fresh increase. In the stated case, the price may perhaps rise towards the $24,500 level. The next major resistance sits near the $25,000 level.
More Losses in BTC?
If bitcoin fails to clear the $23,300 resistance zone, it could continue to move down. An immediate support on the downside is near the $22,800 level.
The next major support now sits near the $22,680 level. It is near the 50% Fib retracement level of the upward move from the $20,695 swing low to $24,670 high. Any more losses might send the price towards $22,000 level.
Technical indicators:
Hourly MACD – The MACD is now gaining pace in the bearish zone.
Hourly RSI (Relative Strength Index) – The RSI for BTC/USD is now below the 50 level.
Major Support Levels – $22,680, followed by $22,000.
Major Resistance Levels – $23,300, $23,750 and $24,000.
Tags: bitcoinbtcusdBTCUSDTxbtusd
NewsBTCRead More


Recent Posts
What’s Next for Bitcoin With Crypto Market Cheering Trump’s Trade Deal Hype?
Bitcoin (BTC) is fast closing on the $100,000 mark as U.S. President Donald Trump teased…
Arthur Hayes Says Bitcoin Will Hit $1M by 2028 as U.S.-China Craft Hollow Trade Deal
Arthur Hayes has a message for crypto investors and bitcoin (BTC) HODLers obsessing over Federal…
Bitcoin Nears $100K as Trump Teases ‘Big’ Trade Deal
Bitcoin zoomed close to $100,000 early Thursday as President Donald Trump said a tariff deal…
Bitcoin Investors Are Taking Profits Aggressively – Signs Of A Local Top?
According to a recent CryptoQuant Quicktake post, Bitcoin (BTC) investors are aggressively taking profits following…
Bitcoin Rebounds After Sharp Drop As Whales Fuel Push Toward $100K
Bitcoin fell hard before recovering as prices plummeted below $95,000, retreating below $94,600 and even…
Only XRP Still In Profit Among Euphoric Buyers—BTC and SOL Deep In Losses
On-chain data shows the top buyers of XRP are still in an 11% net profit…