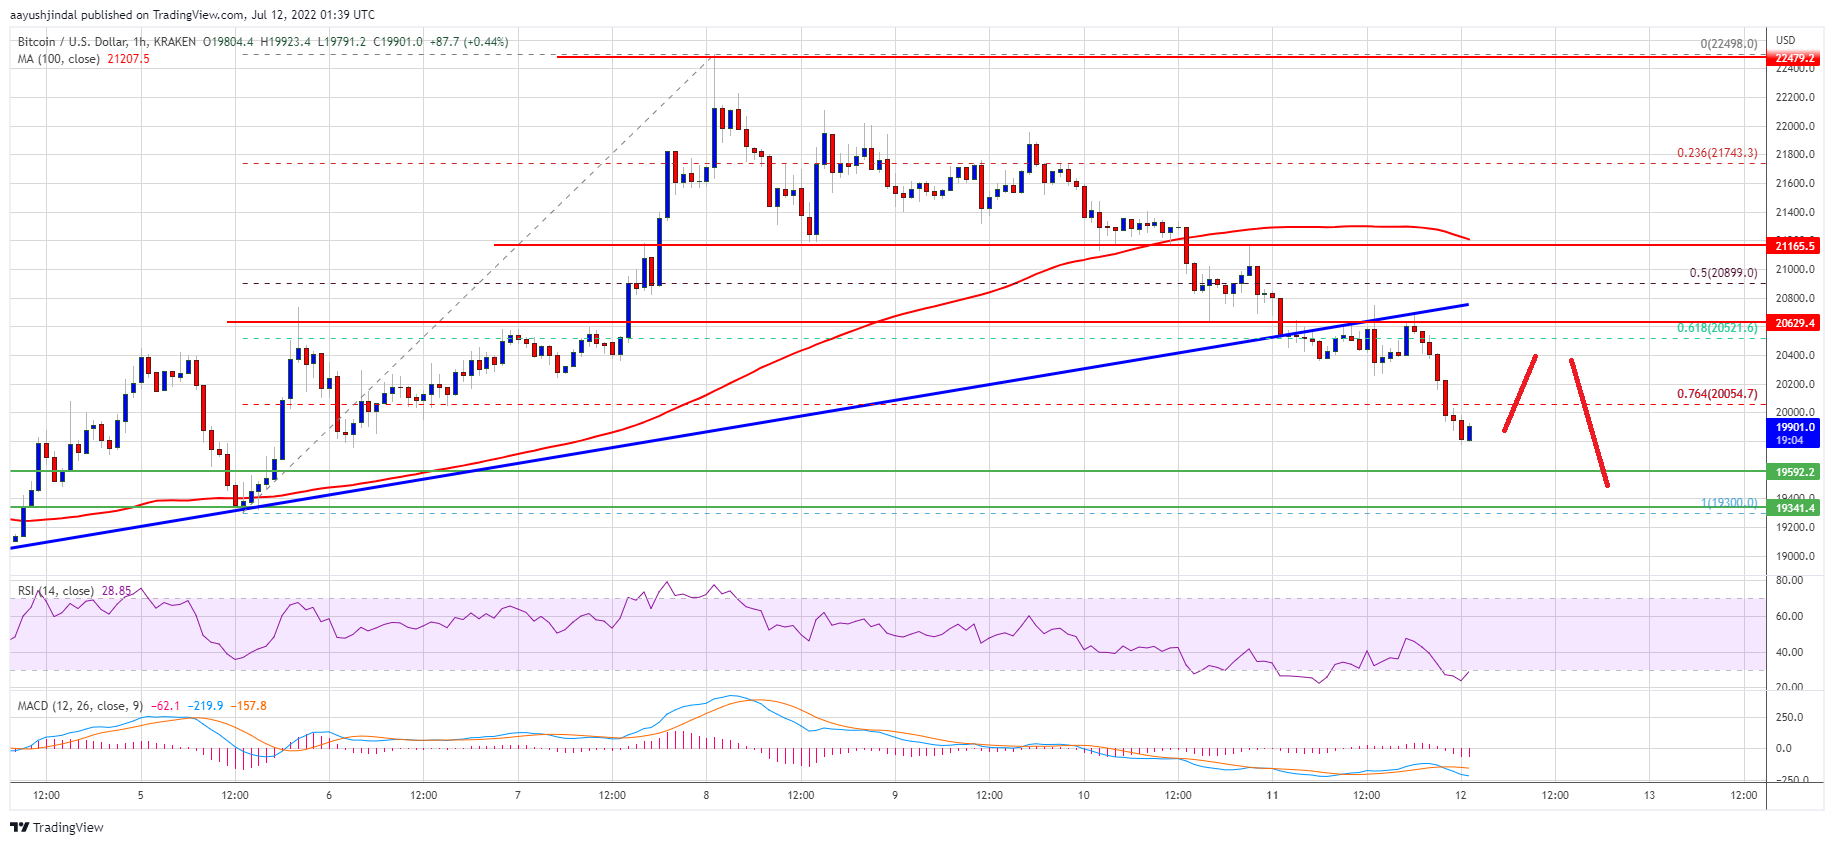
Bitcoin extended losses and traded below $20,000 against the US Dollar. BTC could revisit the key $19,500 support zone, where the bears might be tested.
Bitcoin is following a bearish path below the $20,500 pivot level.
The price is now trading below the $20,500 level and the 100 hourly simple moving average.
There was a break below a major bullish trend line with support near $20,500 on the hourly chart of the BTC/USD pair (data feed from Kraken).
The pair might find support near the $19,500 and $19,350 levels.
Bitcoin Price Extends Losses
Bitcoin price started a fresh decline after it failed to stay above the $22,000 level. There was a steady decline below the $21,200 and $21,000 levels.
The price moved below the 61.8% Fib retracement level of the upward move from the $19,301 swing low to $22,500 swing high. Besides, there was a break below a major bullish trend line with support near $20,500 on the hourly chart of the BTC/USD pair.
Bitcoin price is now trading below the $20,500 level and the 100 hourly simple moving average. It even settled below the 76.4% Fib retracement level of the upward move from the $19,301 swing low to $22,500 swing high.
However, there is a major support waiting near $19,500. On the upside, the price could resistance near the $20,000 and $20,150 levels.
Source: BTCUSD on TradingView.com
The next key resistance is near the $20,500 zone (the recent breakdown zone). A close above the $20,500 resistance zone could set the pace for a test of the 100 hourly simple moving average. Any more gains might open the doors for a move towards the $21,750 level. The next major resistance sits near the $22,000 level.
More Losses in BTC?
If bitcoin fails to start a recovery wave above the $20,150 level, it could continue to move down. An immediate support on the downside is near the $19,580 level.
The next major support now sits near the $19,300 level or the last swing low. A close below the $19,300 support zone could accelerate losses. In the stated case, there is a risk of a move towards the $18,500 level.
Technical indicators:
Hourly MACD – The MACD is now gaining pace in the bearish zone.
Hourly RSI (Relative Strength Index) – The RSI for BTC/USD is now in the oversold zone.
Major Support Levels – $19,600, followed by $19,300.
Major Resistance Levels – $20,150, $20,500 and $21,750.
Bitcoin extended losses and traded below $20,000 against the US Dollar. BTC could revisit the key $19,500 support zone, where the bears might be tested.
Bitcoin is following a bearish path below the $20,500 pivot level.
The price is now trading below the $20,500 level and the 100 hourly simple moving average.
There was a break below a major bullish trend line with support near $20,500 on the hourly chart of the BTC/USD pair (data feed from Kraken).
The pair might find support near the $19,500 and $19,350 levels.
Bitcoin price started a fresh decline after it failed to stay above the $22,000 level. There was a steady decline below the $21,200 and $21,000 levels.
The price moved below the 61.8% Fib retracement level of the upward move from the $19,301 swing low to $22,500 swing high. Besides, there was a break below a major bullish trend line with support near $20,500 on the hourly chart of the BTC/USD pair.
Bitcoin price is now trading below the $20,500 level and the 100 hourly simple moving average. It even settled below the 76.4% Fib retracement level of the upward move from the $19,301 swing low to $22,500 swing high.
However, there is a major support waiting near $19,500. On the upside, the price could resistance near the $20,000 and $20,150 levels.
Source: BTCUSD on TradingView.com
The next key resistance is near the $20,500 zone (the recent breakdown zone). A close above the $20,500 resistance zone could set the pace for a test of the 100 hourly simple moving average. Any more gains might open the doors for a move towards the $21,750 level. The next major resistance sits near the $22,000 level.
If bitcoin fails to start a recovery wave above the $20,150 level, it could continue to move down. An immediate support on the downside is near the $19,580 level.
The next major support now sits near the $19,300 level or the last swing low. A close below the $19,300 support zone could accelerate losses. In the stated case, there is a risk of a move towards the $18,500 level.
Technical indicators:
Hourly MACD – The MACD is now gaining pace in the bearish zone.
Hourly RSI (Relative Strength Index) – The RSI for BTC/USD is now in the oversold zone.
Major Support Levels – $19,600, followed by $19,300.
Major Resistance Levels – $20,150, $20,500 and $21,750.
Tags: bitcoinbtcusdBTCUSDTxbtusd
FeedzyRead More
There have been recent concerns within the crypto community regarding Binance’s recent activities after a…
By launching its Macro Strategic Reserve, World Liberty Financial (WLFI) has advanced significantly and strengthened…
Bitcoin (BTC) continues to move within its one-week range after recovering from its recent drop…
Alexander Vinnik, the jailed former operator of once mighty bitcoin exchange BTC-e, is being released…
Founder: Nicolas Burtey Date Founded: September 2019 Location of Headquarters: United States Number of Employees:…
Bitcoin Twitter (or Bitcoin X) is having a moment after a 13F filing by Goldman…