Bitcoin is struggling to recover above $21,500 against the US Dollar. BTC is consolidating and remains at a risk of a move towards the $20,000 support.
Bitcoin is consolidating above $21,000 and facing a lot of hurdles.
The price is now trading above the $21,200 level and the 100 hourly simple moving average.
There is a key bearish trend line forming with resistance near $22,500 on the hourly chart of the BTC/USD pair (data feed from Kraken).
The pair could recover higher, but upsides might be limited above the $22,000 resistance zone.
Bitcoin Price Faces Hurdles
Bitcoin price remained well bid above the $21,000 support zone. BTC formed a base above $21,000 and started a consolidation phase.
There was a minor upward move above the $21,250 and $21,350 levels. The price was able to surpass the $21,500 level and the 100 hourly simple moving average. However, the bears were active near the $21,640 resistance zone.
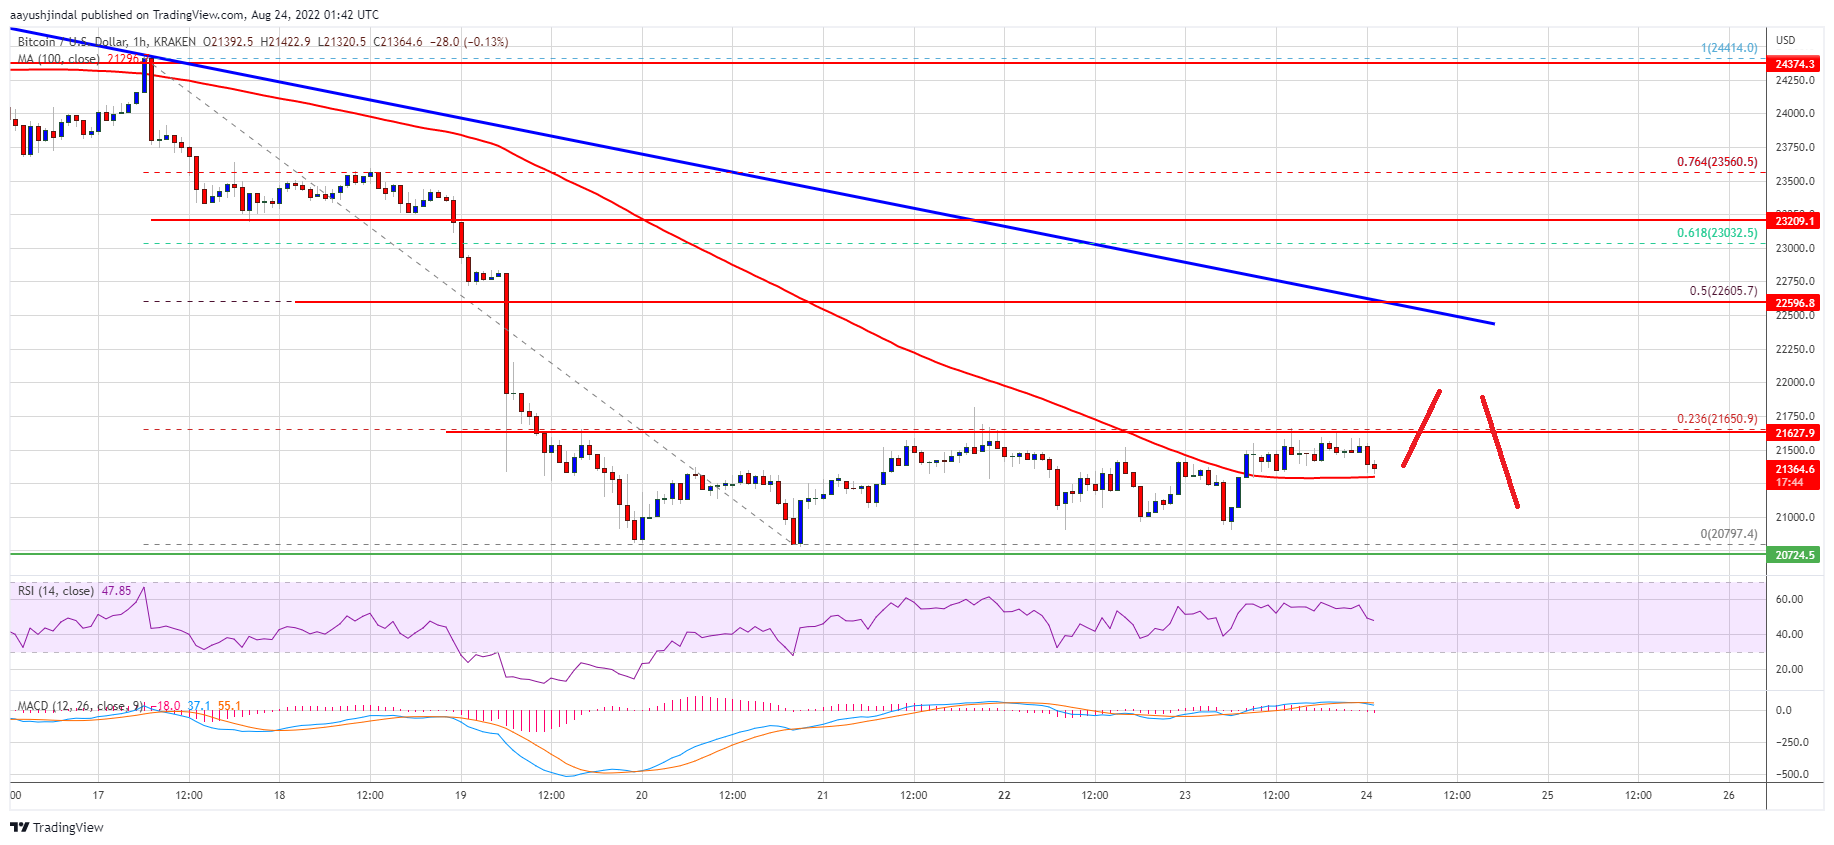
It seems like the 23.6% Fib retracement level of the main drop from the $24,415 swing high to $20,797 low is acting as a strong resistance. Bitcoin price is now trading above the $21,200 level and the 100 hourly simple moving average.
On the upside, an immediate resistance is near the $21,500 and $21,640 levels. The first major resistance on the upside sits near the $22,000 level.
If there is an upside break above the $22,000 resistance zone, the price may perhaps rise towards the $22,500 resistance zone. There is also a key bearish trend line forming with resistance near $22,500 on the hourly chart of the BTC/USD pair.
Source: BTCUSD on TradingView.com
The trend line is near the 50% Fib retracement level of the main drop from the $24,415 swing high to $20,797 low. Any more gains might send the price towards the $23,000 resistance zone.
Fresh Decline in BTC?
If bitcoin fails to clear the $22,000 resistance zone, it could continue to move down. An immediate support on the downside is near the $21,000 level.
The next major support now sits near the $20,800 level. A clear move below the $20,800 support and the last swing low might spark a fresh decline. In the stated case, the price might decline towards the $20,000 level.
Technical indicators:
Hourly MACD – The MACD is now losing pace in the bearish zone.
Hourly RSI (Relative Strength Index) – The RSI for BTC/USD is now near the 50 level.
Major Support Levels – $21,000, followed by $20,800.
Major Resistance Levels – $21,640, $22,000 and $22,500.
Bitcoin is struggling to recover above $21,500 against the US Dollar. BTC is consolidating and remains at a risk of a move towards the $20,000 support.
Bitcoin is consolidating above $21,000 and facing a lot of hurdles.
The price is now trading above the $21,200 level and the 100 hourly simple moving average.
There is a key bearish trend line forming with resistance near $22,500 on the hourly chart of the BTC/USD pair (data feed from Kraken).
The pair could recover higher, but upsides might be limited above the $22,000 resistance zone.
Bitcoin price remained well bid above the $21,000 support zone. BTC formed a base above $21,000 and started a consolidation phase.
There was a minor upward move above the $21,250 and $21,350 levels. The price was able to surpass the $21,500 level and the 100 hourly simple moving average. However, the bears were active near the $21,640 resistance zone.
It seems like the 23.6% Fib retracement level of the main drop from the $24,415 swing high to $20,797 low is acting as a strong resistance. Bitcoin price is now trading above the $21,200 level and the 100 hourly simple moving average.
On the upside, an immediate resistance is near the $21,500 and $21,640 levels. The first major resistance on the upside sits near the $22,000 level.
If there is an upside break above the $22,000 resistance zone, the price may perhaps rise towards the $22,500 resistance zone. There is also a key bearish trend line forming with resistance near $22,500 on the hourly chart of the BTC/USD pair.
Source: BTCUSD on TradingView.com
The trend line is near the 50% Fib retracement level of the main drop from the $24,415 swing high to $20,797 low. Any more gains might send the price towards the $23,000 resistance zone.
If bitcoin fails to clear the $22,000 resistance zone, it could continue to move down. An immediate support on the downside is near the $21,000 level.
The next major support now sits near the $20,800 level. A clear move below the $20,800 support and the last swing low might spark a fresh decline. In the stated case, the price might decline towards the $20,000 level.
Technical indicators:
Hourly MACD – The MACD is now losing pace in the bearish zone.
Hourly RSI (Relative Strength Index) – The RSI for BTC/USD is now near the 50 level.
Major Support Levels – $21,000, followed by $20,800.
Major Resistance Levels – $21,640, $22,000 and $22,500.
Tags: bitcoinbtcusdBTCUSDTxbtusd
NewsBTCRead More
Bitcoin banks are going to happen. We already have a few of them. We’re going…
There have been recent concerns within the crypto community regarding Binance’s recent activities after a…
By launching its Macro Strategic Reserve, World Liberty Financial (WLFI) has advanced significantly and strengthened…
Bitcoin (BTC) continues to move within its one-week range after recovering from its recent drop…
Alexander Vinnik, the jailed former operator of once mighty bitcoin exchange BTC-e, is being released…
Founder: Nicolas Burtey Date Founded: September 2019 Location of Headquarters: United States Number of Employees:…