Bitcoin price is consolidating losses above the $19,200 support zone against the US Dollar. BTC could start a fresh increase if there is a clear move above $19,700.
Bitcoin is facing barrier near the $19,550 and $19,600 resistance levels.
The price is below above $20,100 and the 100 hourly simple moving average.
There was a break above a key bearish trend line with resistance near $19,450 on the hourly chart of the BTC/USD pair (data feed from Kraken).
The pair could gain bullish momentum if there is a clear move above the $19,700 resistance.
Bitcoin Price Holds Key Support
Bitcoin price started a fresh decline from well above the $20,200 level. BTC declined below the $20,000 and $19,800 levels to move into a bearish zone.
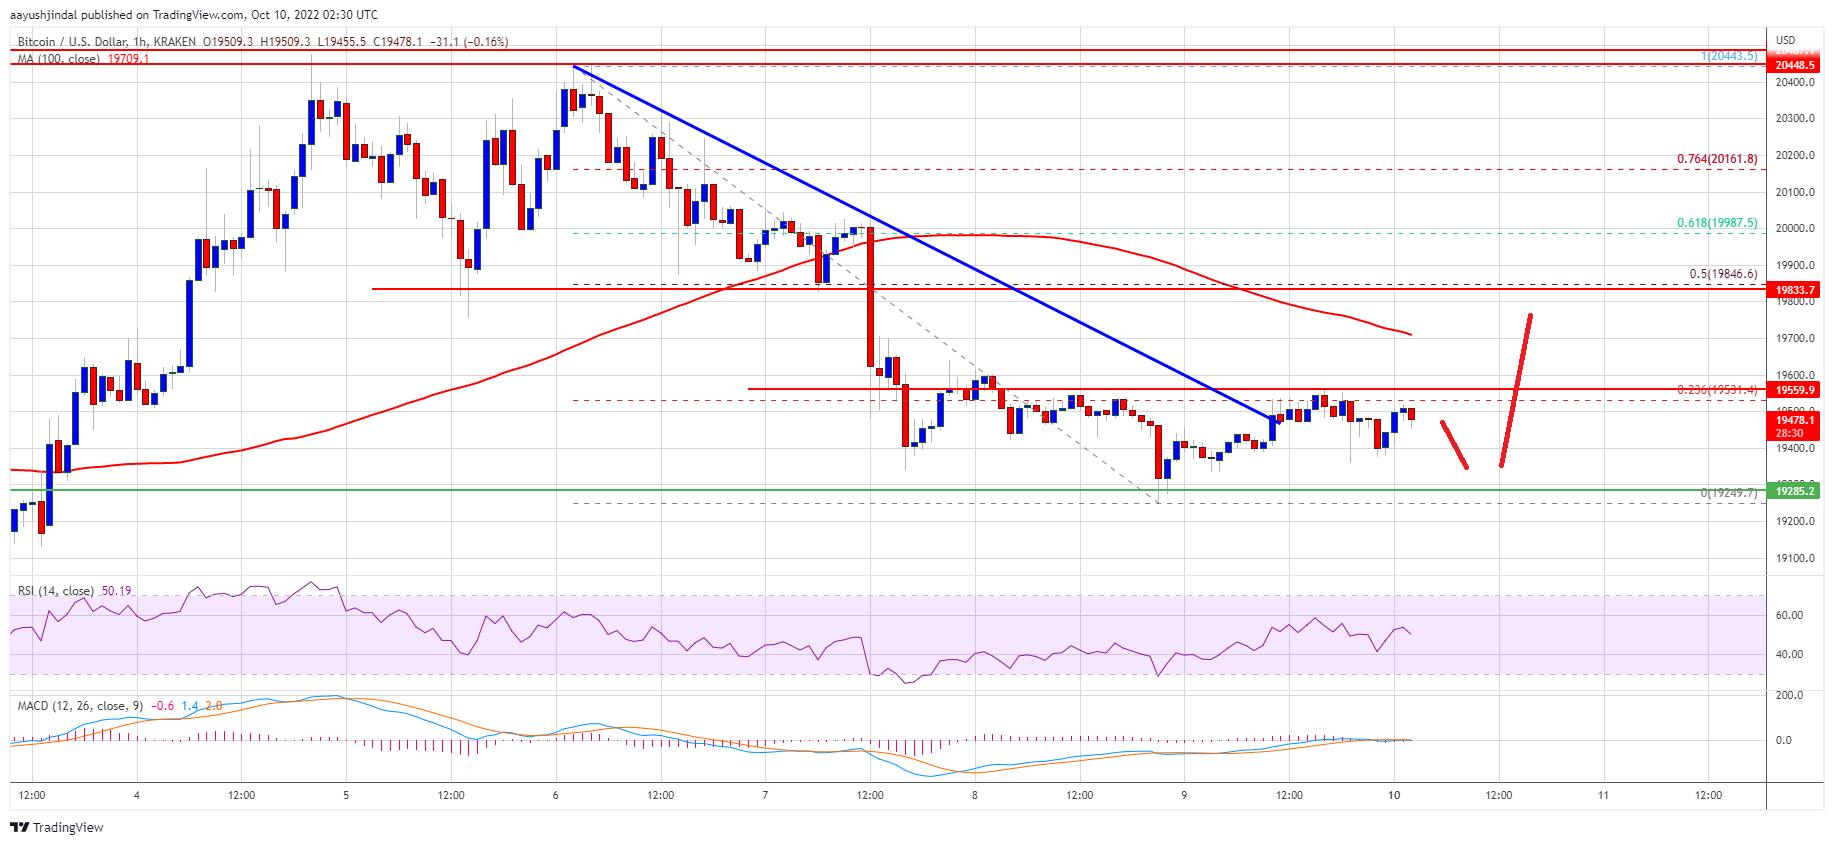
The bears even pushed the price below the $19,500 level and the 100 hourly simple moving average. It traded as low as $19,249 and recently started a short-term upside correction. There was a minor increase above the $19,400 and $19,500 levels.
There was a break above a key bearish trend line with resistance near $19,450 on the hourly chart of the BTC/USD pair. Bitcoin price tested the 23.6% Fib retracement level of the downward move from the $20,443 swing high to $19,249 low.
On the upside, an immediate resistance is near the $19,550 level. The next major resistance sits near the $19,700 zone and the 100 hourly simple moving average.
Source: BTCUSD on TradingView.com
A proper close above the $19,700 resistance might send the price towards the 50% Fib retracement level of the downward move from the $20,443 swing high to $19,249 low. Any more gains might send the price above the $20,000 resistance. In the stated case, the price could rise towards the $20,500 resistance level.
Dips Limited in BTC?
If bitcoin fails to rise above the $19,700 resistance zone, it could continue to move down. An immediate support on the downside is near the $19,400 zone.
The next major support is near the $19,250 zone. A downside break below the $19,250 support zone might call for more losses. In the stated case, there is a risk of a move towards the $18,500 support zone.
Technical indicators:
Hourly MACD – The MACD is now losing pace in the bearish zone.
Hourly RSI (Relative Strength Index) – The RSI for BTC/USD is now above the 50 level.
Major Support Levels – $19,400, followed by $19,250.
Major Resistance Levels – $19,700, $20,000 and $20,500.
Bitcoin price is consolidating losses above the $19,200 support zone against the US Dollar. BTC could start a fresh increase if there is a clear move above $19,700.
Bitcoin is facing barrier near the $19,550 and $19,600 resistance levels.
The price is below above $20,100 and the 100 hourly simple moving average.
There was a break above a key bearish trend line with resistance near $19,450 on the hourly chart of the BTC/USD pair (data feed from Kraken).
The pair could gain bullish momentum if there is a clear move above the $19,700 resistance.
Bitcoin price started a fresh decline from well above the $20,200 level. BTC declined below the $20,000 and $19,800 levels to move into a bearish zone.
The bears even pushed the price below the $19,500 level and the 100 hourly simple moving average. It traded as low as $19,249 and recently started a short-term upside correction. There was a minor increase above the $19,400 and $19,500 levels.
There was a break above a key bearish trend line with resistance near $19,450 on the hourly chart of the BTC/USD pair. Bitcoin price tested the 23.6% Fib retracement level of the downward move from the $20,443 swing high to $19,249 low.
On the upside, an immediate resistance is near the $19,550 level. The next major resistance sits near the $19,700 zone and the 100 hourly simple moving average.
Source: BTCUSD on TradingView.com
A proper close above the $19,700 resistance might send the price towards the 50% Fib retracement level of the downward move from the $20,443 swing high to $19,249 low. Any more gains might send the price above the $20,000 resistance. In the stated case, the price could rise towards the $20,500 resistance level.
If bitcoin fails to rise above the $19,700 resistance zone, it could continue to move down. An immediate support on the downside is near the $19,400 zone.
The next major support is near the $19,250 zone. A downside break below the $19,250 support zone might call for more losses. In the stated case, there is a risk of a move towards the $18,500 support zone.
Technical indicators:
Hourly MACD – The MACD is now losing pace in the bearish zone.
Hourly RSI (Relative Strength Index) – The RSI for BTC/USD is now above the 50 level.
Major Support Levels – $19,400, followed by $19,250.
Major Resistance Levels – $19,700, $20,000 and $20,500.
Tags: bitcoinbtcusdBTCUSDTxbtusd
NewsBTCRead More
Bitcoin (BTC) continued to slide on Monday, hurt by not just by massive bearish price…
Robert Kiyosaki, a popular author and Bitcoin supporter, is back in the headlines after claiming…
Analysts are currently leaning towards a further breakdown in the Bitcoin price, as market volatility…
HK Asia Holdings Limited, a top investment firm in Hong Kong, is the latest to…
In a new research report shared on X, Joe Consorti, Head of Growth at Theya,…
Bitcoin's (BTC) recent narrow price range between $94,000 and $100,000 has perplexed many market participants.…