Bitcoin extended losses below the $23,650 support zone against the US Dollar. BTC must stay above $23,200 to avoid more losses in the near term.
Bitcoin remained in a bearish zone and traded below the $23,650 support.
The price is now trading below the $23,650 level and the 100 hourly simple moving average.
There is a connecting bearish trend line forming with resistance near $24,000 on the hourly chart of the BTC/USD pair (data feed from Kraken).
The pair could extend losses if there is a clear move below the $23,200 support in the near term.
Bitcoin Price Drops Further
Bitcoin price failed to stay in a positive zone above the $24,000 level. BTC started another decline and traded below the $23,650 support zone.
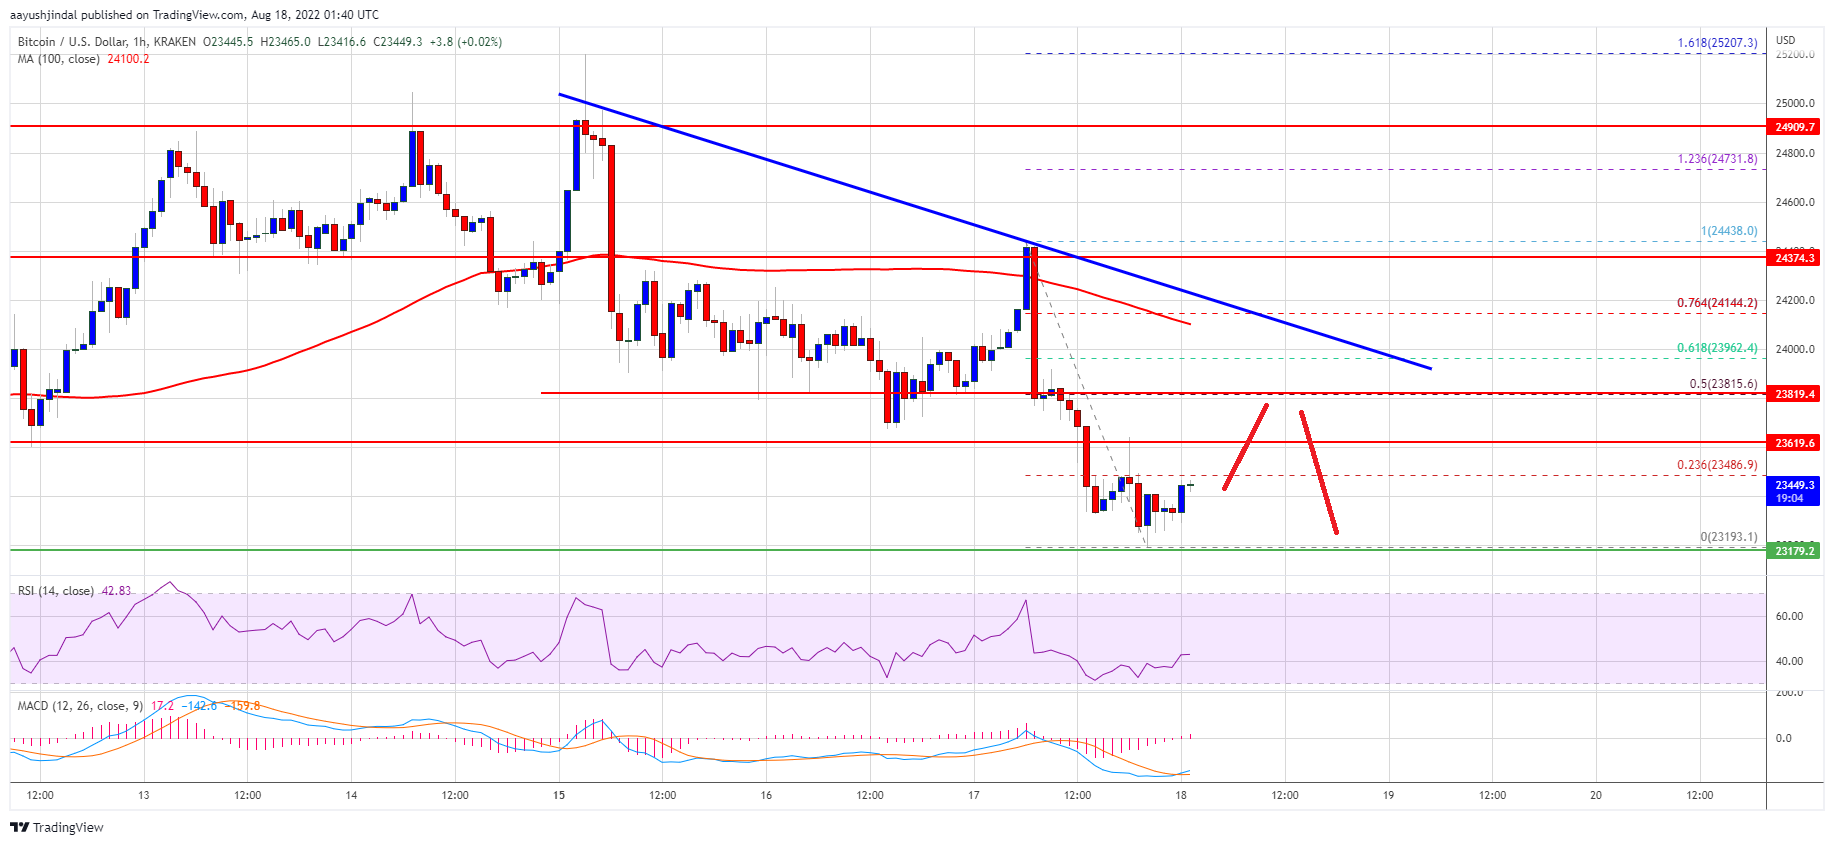
There was a clear move below the $23,500 level and the 100 hourly simple moving average. Finally, the price found support near the $23,200 zone. A low was formed near $23,193 and the price is now consolidating losses.
Bitcoin price is now trading below the $23,650 level and the 100 hourly simple moving average. On the upside, an immediate resistance is near the $23,500 level. It is near the 23.6% Fib retracement level of the recent decline from the $24,438 swing high to $23,193 low.
The first major resistance on the upside sits near the $23,800 level. It is near the 50% Fib retracement level of the recent decline from the $24,438 swing high to $23,193 low.
The main resistance is forming near the $24,000 zone and the 100 hourly simple moving average. There is also a connecting bearish trend line forming with resistance near $24,000 on the hourly chart of the BTC/USD pair. A close above the $23,800 and $24,000 resistance levels might start another increase.
Source: BTCUSD on TradingView.com
In the stated case, the price may perhaps climb towards the $24,500 resistance. Any more gains might send the price towards the $25,000 level.
More Losses in BTC?
If bitcoin fails to clear the $24,000 resistance zone, it could continue to move down. An immediate support on the downside is near the $23,320 level.
The next major support now sits near the $23,200 level. A downside break and close below the $23,200 level might spark another decline. In the stated case, the price might decline towards the $22,750 level.
Technical indicators:
Hourly MACD – The MACD is now losing pace in the bearish zone.
Hourly RSI (Relative Strength Index) – The RSI for BTC/USD is now below the 50 level.
Major Support Levels – $23,320, followed by $23,200.
Major Resistance Levels – $23,500, $23,800 and $24,000.
Bitcoin extended losses below the $23,650 support zone against the US Dollar. BTC must stay above $23,200 to avoid more losses in the near term.
Bitcoin remained in a bearish zone and traded below the $23,650 support.
The price is now trading below the $23,650 level and the 100 hourly simple moving average.
There is a connecting bearish trend line forming with resistance near $24,000 on the hourly chart of the BTC/USD pair (data feed from Kraken).
The pair could extend losses if there is a clear move below the $23,200 support in the near term.
Bitcoin price failed to stay in a positive zone above the $24,000 level. BTC started another decline and traded below the $23,650 support zone.
There was a clear move below the $23,500 level and the 100 hourly simple moving average. Finally, the price found support near the $23,200 zone. A low was formed near $23,193 and the price is now consolidating losses.
Bitcoin price is now trading below the $23,650 level and the 100 hourly simple moving average. On the upside, an immediate resistance is near the $23,500 level. It is near the 23.6% Fib retracement level of the recent decline from the $24,438 swing high to $23,193 low.
The first major resistance on the upside sits near the $23,800 level. It is near the 50% Fib retracement level of the recent decline from the $24,438 swing high to $23,193 low.
The main resistance is forming near the $24,000 zone and the 100 hourly simple moving average. There is also a connecting bearish trend line forming with resistance near $24,000 on the hourly chart of the BTC/USD pair. A close above the $23,800 and $24,000 resistance levels might start another increase.
Source: BTCUSD on TradingView.com
In the stated case, the price may perhaps climb towards the $24,500 resistance. Any more gains might send the price towards the $25,000 level.
If bitcoin fails to clear the $24,000 resistance zone, it could continue to move down. An immediate support on the downside is near the $23,320 level.
The next major support now sits near the $23,200 level. A downside break and close below the $23,200 level might spark another decline. In the stated case, the price might decline towards the $22,750 level.
Technical indicators:
Hourly MACD – The MACD is now losing pace in the bearish zone.
Hourly RSI (Relative Strength Index) – The RSI for BTC/USD is now below the 50 level.
Major Support Levels – $23,320, followed by $23,200.
Major Resistance Levels – $23,500, $23,800 and $24,000.
Tags: bitcoinbtcusdBTCUSDTxbtusd
NewsBTCRead More
There have been recent concerns within the crypto community regarding Binance’s recent activities after a…
By launching its Macro Strategic Reserve, World Liberty Financial (WLFI) has advanced significantly and strengthened…
Bitcoin (BTC) continues to move within its one-week range after recovering from its recent drop…
Alexander Vinnik, the jailed former operator of once mighty bitcoin exchange BTC-e, is being released…
Founder: Nicolas Burtey Date Founded: September 2019 Location of Headquarters: United States Number of Employees:…
Bitcoin Twitter (or Bitcoin X) is having a moment after a 13F filing by Goldman…