TA: Bitcoin Remains In Downtrend, What Could Spark Sharp Upside
Bitcoin is trading in a bearish zone below $19,500 against the US Dollar. BTC might start a sharp recovery wave if there is a move above the $19,500 resistance.
Bitcoin failed to gain pace above the $19,500 and $19,600 resistance levels.
The price is now trading below the $20,000 level and the 100 hourly simple moving average.
There is a crucial bearish trend line forming with resistance near $19,500 on the hourly chart of the BTC/USD pair (data feed from Kraken).
The pair could start a fresh decline unless there is a move above the $19,500 resistance zone.
Bitcoin Price Eyes Upside Break
Bitcoin price started another decline below the $19,500 support zone. The price even traded below the $19,000 support zone and spiked below the $18,800 level.
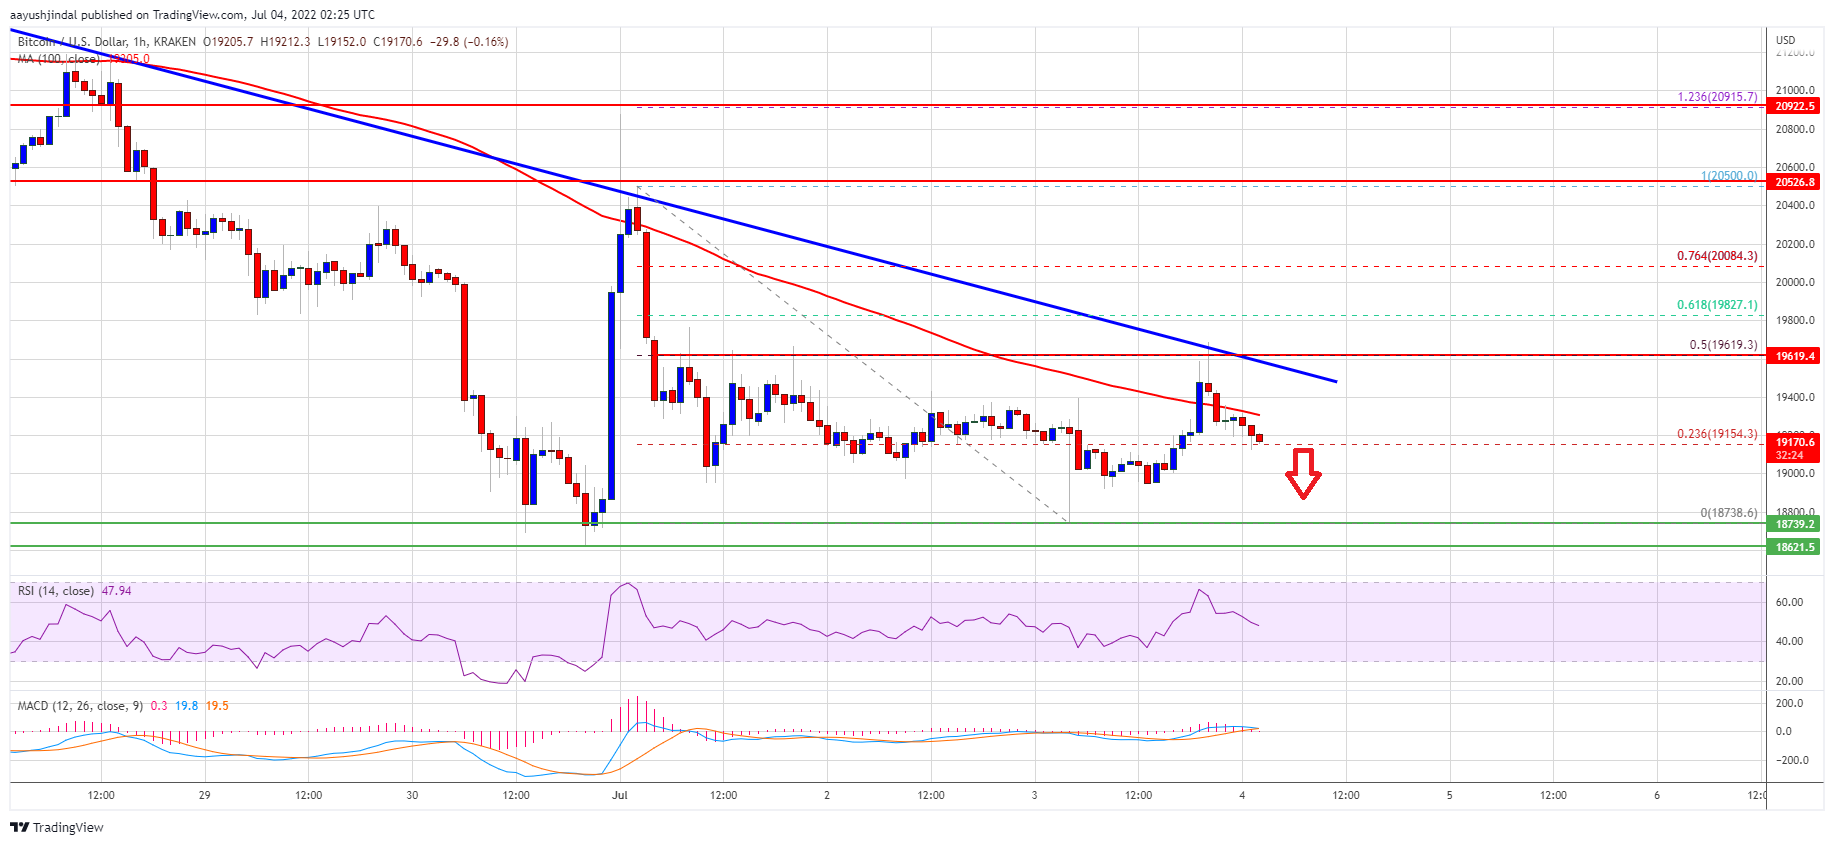
A low was formed near $18,738 and the price is now consolidating losses. There was a minor upward move above the $19,000 resistance zone. The price climbed above the 23.6% Fib retracement level of the recent decline from the $20,500 swing high to $18,738 low.
However, the price is now facing a strong resistance near the $19,400 zone and the 100 hourly simple moving average. There is also a crucial bearish trend line forming with resistance near $19,500 on the hourly chart of the BTC/USD pair.
The trend line is close to the 50% Fib retracement level of the recent decline from the $20,500 swing high to $18,738 low.
Source: BTCUSD on TradingView.com
The next key resistance is near the $19,800 zone. A clear move above the trend line resistance and then $19,800 could push the price further higher. In the stated case, the price could rise towards the $20,500 level. The next major resistance sits near the $21,200 level.
Fresh Decline in BTC?
If bitcoin fails to clear the $19,500 resistance zone, it could start another decline. An immediate support on the downside is near the $19,000 level.
The next major support now sits near the $18,700 level, below which the price could decline heavily. In the stated case, the price may perhaps decline towards the $17,500 level.
Technical indicators:
Hourly MACD – The MACD is now losing pace in the bullish zone.
Hourly RSI (Relative Strength Index) – The RSI for BTC/USD is now below the 50 level.
Major Support Levels – $19,000, followed by $18,700.
Major Resistance Levels – $19,500, $19,800 and $20,500.
Bitcoin is trading in a bearish zone below $19,500 against the US Dollar. BTC might start a sharp recovery wave if there is a move above the $19,500 resistance.
Bitcoin failed to gain pace above the $19,500 and $19,600 resistance levels.
The price is now trading below the $20,000 level and the 100 hourly simple moving average.
There is a crucial bearish trend line forming with resistance near $19,500 on the hourly chart of the BTC/USD pair (data feed from Kraken).
The pair could start a fresh decline unless there is a move above the $19,500 resistance zone.
Bitcoin Price Eyes Upside Break
Bitcoin price started another decline below the $19,500 support zone. The price even traded below the $19,000 support zone and spiked below the $18,800 level.
A low was formed near $18,738 and the price is now consolidating losses. There was a minor upward move above the $19,000 resistance zone. The price climbed above the 23.6% Fib retracement level of the recent decline from the $20,500 swing high to $18,738 low.
However, the price is now facing a strong resistance near the $19,400 zone and the 100 hourly simple moving average. There is also a crucial bearish trend line forming with resistance near $19,500 on the hourly chart of the BTC/USD pair.
The trend line is close to the 50% Fib retracement level of the recent decline from the $20,500 swing high to $18,738 low.
Source: BTCUSD on TradingView.com
The next key resistance is near the $19,800 zone. A clear move above the trend line resistance and then $19,800 could push the price further higher. In the stated case, the price could rise towards the $20,500 level. The next major resistance sits near the $21,200 level.
Fresh Decline in BTC?
If bitcoin fails to clear the $19,500 resistance zone, it could start another decline. An immediate support on the downside is near the $19,000 level.
The next major support now sits near the $18,700 level, below which the price could decline heavily. In the stated case, the price may perhaps decline towards the $17,500 level.
Technical indicators:
Hourly MACD – The MACD is now losing pace in the bullish zone.
Hourly RSI (Relative Strength Index) – The RSI for BTC/USD is now below the 50 level.
Major Support Levels – $19,000, followed by $18,700.
Major Resistance Levels – $19,500, $19,800 and $20,500.
Tags: bitcoinbtcusdBTCUSDTxbtusd
FeedzyRead More


Recent Posts
Bitcoin Ready To Reclaim $90,000? BTC’s ‘Next Big Move’ Could Come Next Week
Amid the market volatility, Bitcoin (BTC) has been unable to reclaim the $85,000-$86,000 zone despite…
Bitcoin Mega Whales Keep Buying—Is Rest Of Market Finally Catching Up?
On-chain data shows the largest of Bitcoin investors have continued to buy recently. Here’s whether…
Bitcoin Stalls at $84K, But Analyst Says 2025 Could Mirror Last Year’s Breakout
Despite broader market interest, Bitcoin continues to hover near the $84,000 mark, showing limited upward…
Bitcoin Enters New Phase: Analyst Predicts Positive Movement In 2025
According to a recent CryptoQuant Quicktake post, Bitcoin (BTC) may be close to completing its…
Crypto Gurus Predict Bitcoin Boom ‘In Days’—But Expert Urges Caution
A swirl of bullish proclamations is ricocheting across X as macro‑minded influencers argue that a…
Bitcoin Enters Oversold Levels, Analyst Warns This Is Bearish, Not Bullish
Crypto analyst Quinten recently revealed that Bitcoin has entered oversold levels. However, analyst Dr. Cat…