Bitcoin started a fresh decline from the $43,400 zone against the US Dollar. BTC remains at a risk of more downsides below the $41,500 level.
Bitcoin started a fresh decline after it failed to surpass $43,400.
The price is now trading below $42,200 and the 100 hourly simple moving average.
There is a key bearish trend line forming with resistance near $43,200 on the hourly chart of the BTC/USD pair (data feed from Kraken).
The pair could start a strong decline if there is a clear move below the $41,500 level.
Bitcoin Price Turns Red
Bitcoin price attempted an upside correction above the $42,500 level. BTC climbed above the $43,000 level, but it faced a strong selling interest near $43,400.
The price also struggled to stay above the $43,000 level and the 100 hourly simple moving average. As a result, there was a fresh decline below the $42,500 support zone. The price gained bearish momentum and traded below $42,000.
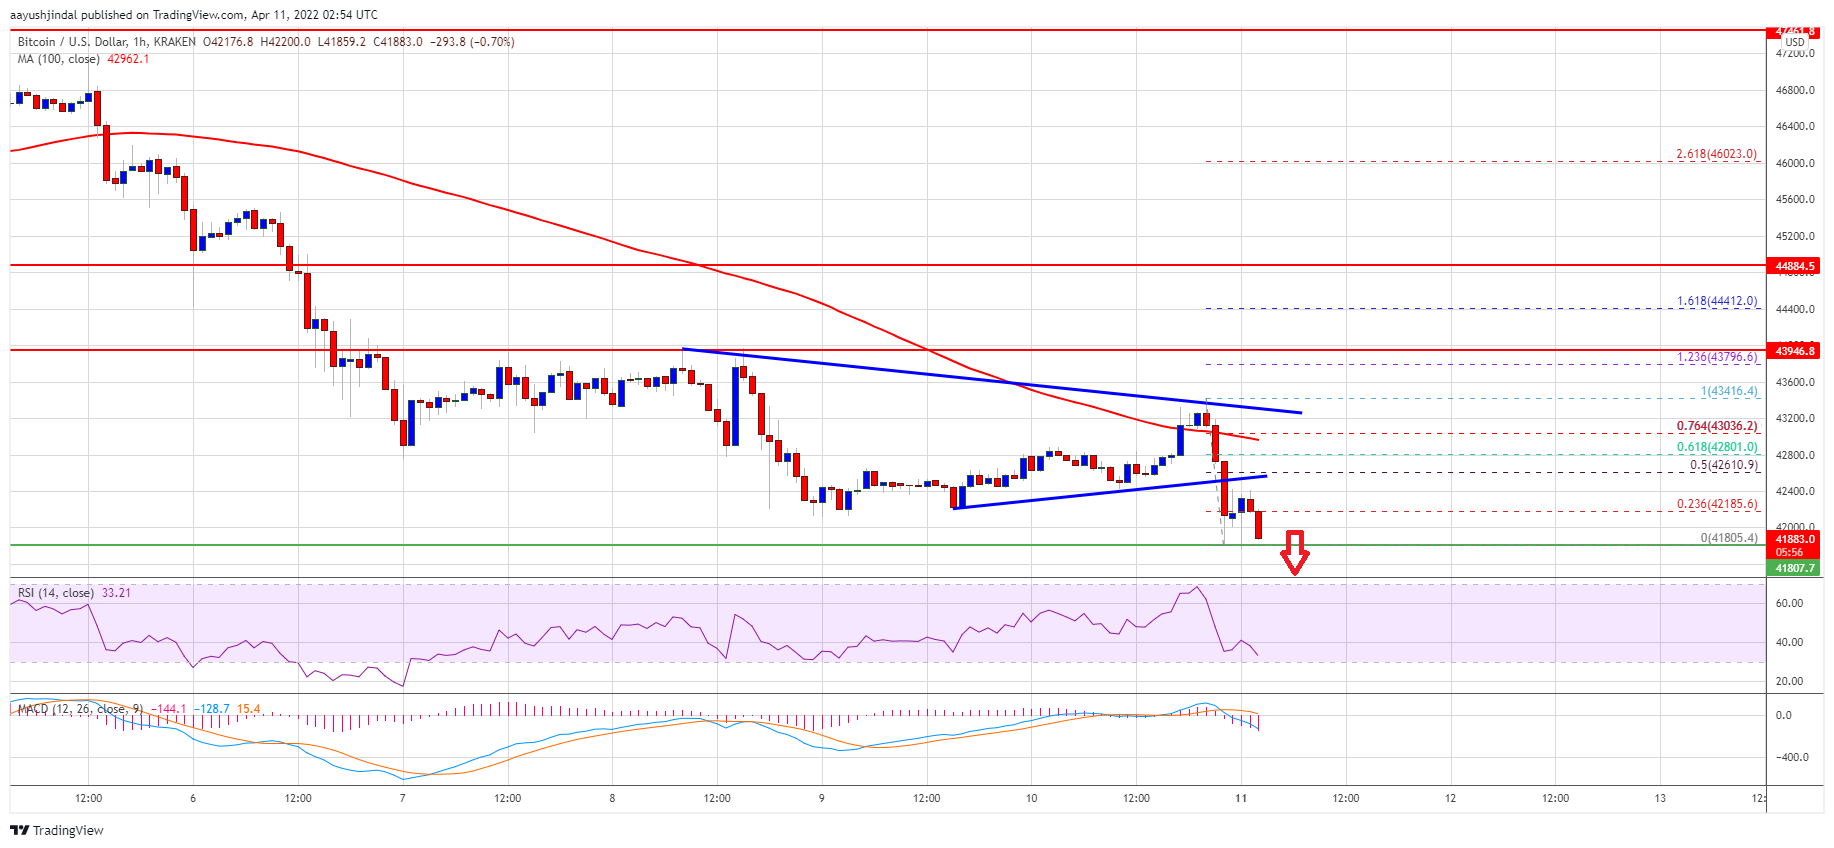
It is now trading below $42,200 and the 100 hourly simple moving average. There is also a key bearish trend line forming with resistance near $43,200 on the hourly chart of the BTC/USD pair.
A low is formed near $41,805 and the price is now consolidating losses. An immediate resistance on the upside is near the $42,185 level. It is close to the 23.6% Fib retracement level of the recent decline from the $43,416 swing high from the $41,805 low.
The next resistance could be near $42,600. It is near a pivot zone and the 50% Fib retracement level of the recent decline from the $43,416 swing high from the $41,805 low. The main resistance is now forming near $43,000 and the 100 hourly SMA.
Source: BTCUSD on TradingView.com
Bitcoin price must clear the $42,600 and $43,000 resistance levels to start a decent increase. In the stated case, the price may perhaps rise towards the $43,600 resistance zone.
More Losses in BTC?
If bitcoin fails to clear the $43,000 resistance zone, it could continue to move down. An immediate support on the downside is near the $41,800 level.
The next major support is seen near the $41,500 level. A downside break below the $41,500 support zone could accelerate losses. In the stated case, the price could drop towards the $40,500 support in the near term. The next major support might be $40,000.
Technical indicators:
Hourly MACD – The MACD is now gaining pace in the bearish zone.
Hourly RSI (Relative Strength Index) – The RSI for BTC/USD is now below the 50 level.
Major Support Levels – $41,500, followed by $40,500.
Major Resistance Levels – $42,600, $43,000 and $43,600.
Bitcoin started a fresh decline from the $43,400 zone against the US Dollar. BTC remains at a risk of more downsides below the $41,500 level.
Bitcoin started a fresh decline after it failed to surpass $43,400.
The price is now trading below $42,200 and the 100 hourly simple moving average.
There is a key bearish trend line forming with resistance near $43,200 on the hourly chart of the BTC/USD pair (data feed from Kraken).
The pair could start a strong decline if there is a clear move below the $41,500 level.
Bitcoin price attempted an upside correction above the $42,500 level. BTC climbed above the $43,000 level, but it faced a strong selling interest near $43,400.
The price also struggled to stay above the $43,000 level and the 100 hourly simple moving average. As a result, there was a fresh decline below the $42,500 support zone. The price gained bearish momentum and traded below $42,000.
It is now trading below $42,200 and the 100 hourly simple moving average. There is also a key bearish trend line forming with resistance near $43,200 on the hourly chart of the BTC/USD pair.
A low is formed near $41,805 and the price is now consolidating losses. An immediate resistance on the upside is near the $42,185 level. It is close to the 23.6% Fib retracement level of the recent decline from the $43,416 swing high from the $41,805 low.
The next resistance could be near $42,600. It is near a pivot zone and the 50% Fib retracement level of the recent decline from the $43,416 swing high from the $41,805 low. The main resistance is now forming near $43,000 and the 100 hourly SMA.
Source: BTCUSD on TradingView.com
Bitcoin price must clear the $42,600 and $43,000 resistance levels to start a decent increase. In the stated case, the price may perhaps rise towards the $43,600 resistance zone.
If bitcoin fails to clear the $43,000 resistance zone, it could continue to move down. An immediate support on the downside is near the $41,800 level.
The next major support is seen near the $41,500 level. A downside break below the $41,500 support zone could accelerate losses. In the stated case, the price could drop towards the $40,500 support in the near term. The next major support might be $40,000.
Technical indicators:
Hourly MACD – The MACD is now gaining pace in the bearish zone.
Hourly RSI (Relative Strength Index) – The RSI for BTC/USD is now below the 50 level.
Major Support Levels – $41,500, followed by $40,500.
Major Resistance Levels – $42,600, $43,000 and $43,600.
Tags: bitcoinbtcusdBTCUSDTxbtusd
FeedzyRead More
Bitcoin Magazine The University of Austin (UATX) Partners with the Texas Bitcoin Foundation, Bitcoin Policy…
Bitcoin Magazine Voltage Aims To Bring Bitcoin’s Lightning Network To Every Business In The World…
Bitcoin Magazine How Local Businesses Can Use Bitcoin For Payments I. Introduction Bitcoin is often…
Bitcoin Magazine Bitcoin Price Set for Big Move as Volatility Drops Bitcoin appears to be…
Bitcoin Magazine FPPS Is Not A Free Lunch For Bitcoin Miners Bitcoin mining is a…
Bitcoin Magazine Conference Bitcoin Afrique: A Bitcoin-Only Revolution in French-Speaking Africa In April 2025, Bitcoiners…