TA: Bitcoin Resumes Downtrend, Why Upsides Remain Capped
Bitcoin failed to gain pace above $40,700 and declined against the US Dollar. BTC traded to a new weekly low and might struggle to climb above $39,200.
Bitcoin started a fresh decline after it failed to clear the key $40,700 resistance zone.
The price is now back below $39,000 and the 100 hourly simple moving average.
There was a break below a connecting bullish trend line with support near $39,500 on the hourly chart of the BTC/USD pair (data feed from Kraken).
The pair could correct higher, but upsides might be capped near $38,800 or $39,200.
Bitcoin Price Declines Sharply
Bitcoin price attempted a clear move above the $40,500 level. However, BTC failed to clear the $40,700 and $40,750 resistance levels.
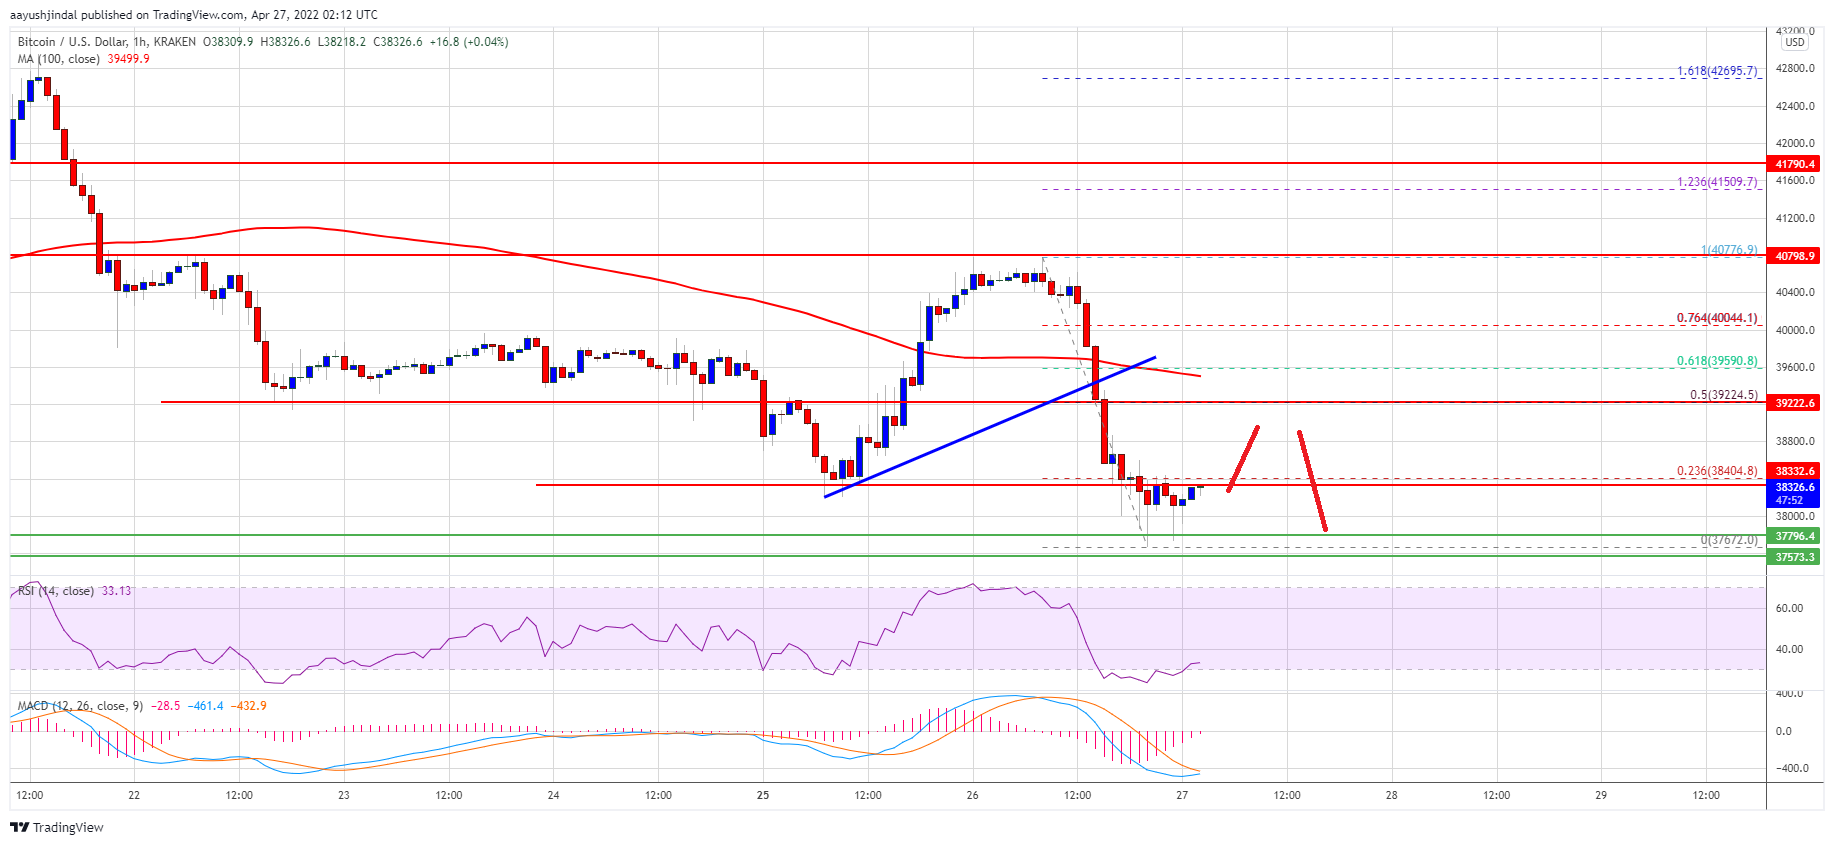
A high was formed near $40,776 and the price reacted to the downside. There was a sharp decline below the $40,000 level and the 100 hourly simple moving average. Besides, there was a break below a connecting bullish trend line with support near $39,500 on the hourly chart of the BTC/USD pair.
Bitcoin is now back below $39,000 and the 100 hourly simple moving average. It traded as low as $37,672 and is currently consolidating losses.
It is testing the 23.6% Fib retracement level of the recent decline from the $40,776 swing high to $37,672 low. An immediate resistance on the upside is near the $38,800 level. The next key resistance could be near the $39,200 zone.
The 50% Fib retracement level of the recent decline from the $40,776 swing high to $37,672 low is also near the $39,250 zone. The main resistance is now forming near the $39,550 level and the 100 hourly simple moving average.
Source: BTCUSD on TradingView.com
If there is a clear move above the $39,200 and $39,550 levels, the price could start a decent increase. In the stated case, the price could even surpass the $40,000 resistance. The next major resistance may perhaps be near the $40,700 zone.
More Losses in BTC?
If bitcoin fails to clear the $39,200 resistance zone, it could continue to move down. An immediate support on the downside is near the $37,650 level.
The next major support is seen near the $37,500 level. A close below the $37,500 support zone might start another decline. In the stated case, the price might drop to $36,200.
Technical indicators:
Hourly MACD – The MACD is slowly losing pace in the bearish zone.
Hourly RSI (Relative Strength Index) – The RSI for BTC/USD is now well below the 50 level.
Major Support Levels – $37,650, followed by $37,500.
Major Resistance Levels – $39,200, $39,550 and $40,000.
Bitcoin failed to gain pace above $40,700 and declined against the US Dollar. BTC traded to a new weekly low and might struggle to climb above $39,200.
Bitcoin started a fresh decline after it failed to clear the key $40,700 resistance zone.
The price is now back below $39,000 and the 100 hourly simple moving average.
There was a break below a connecting bullish trend line with support near $39,500 on the hourly chart of the BTC/USD pair (data feed from Kraken).
The pair could correct higher, but upsides might be capped near $38,800 or $39,200.
Bitcoin Price Declines Sharply
Bitcoin price attempted a clear move above the $40,500 level. However, BTC failed to clear the $40,700 and $40,750 resistance levels.
A high was formed near $40,776 and the price reacted to the downside. There was a sharp decline below the $40,000 level and the 100 hourly simple moving average. Besides, there was a break below a connecting bullish trend line with support near $39,500 on the hourly chart of the BTC/USD pair.
Bitcoin is now back below $39,000 and the 100 hourly simple moving average. It traded as low as $37,672 and is currently consolidating losses.
It is testing the 23.6% Fib retracement level of the recent decline from the $40,776 swing high to $37,672 low. An immediate resistance on the upside is near the $38,800 level. The next key resistance could be near the $39,200 zone.
The 50% Fib retracement level of the recent decline from the $40,776 swing high to $37,672 low is also near the $39,250 zone. The main resistance is now forming near the $39,550 level and the 100 hourly simple moving average.
Source: BTCUSD on TradingView.com
If there is a clear move above the $39,200 and $39,550 levels, the price could start a decent increase. In the stated case, the price could even surpass the $40,000 resistance. The next major resistance may perhaps be near the $40,700 zone.
More Losses in BTC?
If bitcoin fails to clear the $39,200 resistance zone, it could continue to move down. An immediate support on the downside is near the $37,650 level.
The next major support is seen near the $37,500 level. A close below the $37,500 support zone might start another decline. In the stated case, the price might drop to $36,200.
Technical indicators:
Hourly MACD – The MACD is slowly losing pace in the bearish zone.
Hourly RSI (Relative Strength Index) – The RSI for BTC/USD is now well below the 50 level.
Major Support Levels – $37,650, followed by $37,500.
Major Resistance Levels – $39,200, $39,550 and $40,000.
Tags: bitcoinbtcusdBTCUSDTxbtusd
FeedzyRead More


Recent Posts
Strategy Buys $555M of Bitcoin, Increases Total Stash to 538,200 BTC
Strategy (MSTR) has added 6,556 bitcoin (BTC) to its balance sheet, spending $555.8 million in…
Crypto Daybook Americas: Bitcoin Breakout Lifts AI, Memecoins, Underscores Hedge Value
By Omkar Godbole (All times ET unless indicated otherwise) Bitcoin's censorship-resistant, decentralized setup empowers individuals…
BNB, SOL, XRP Spike Higher as Bitcoin ‘Digital Gold’ Narrative Makes a Comeback
Surging gold prices and bitcoin’s (BTC) relatively strong price action amid a global market sell-off…
Bitcoin’s Breakout Signals BTC Potentially Rallying to $90K-$92K: Technical Analysis
This is a daily technical analysis by CoinDesk analyst and Chartered Market Technician Omkar Godbole.…
Bitcoin Surges Above $87,000 In Sudden Move — Here’s The Catalyst
The Bitcoin price spiked to $87,400 on April 21, its highest level since March 29.…
Metaplanet Buys Another 330 BTC as BTC Moves Above $87K
Publicly-listed Metaplanet announced fresh bitcoin (BTC) purchases on Monday as BTC went above $87,300, reversing…