Bitcoin started a steady increase above the $42,000 resistance against the US Dollar. BTC tested the $43,400 zone and recently corrected lower.
Bitcoin started a downside correction after a test of $43,400.
The price is trading above $42,000 and the 100 hourly simple moving average.
There is a key bullish trend line forming with support near $41,950 on the hourly chart of the BTC/USD pair (data feed from Kraken).
The pair must stay above the $41,500 support zone to remain in a positive zone.
Bitcoin Price Remains In Uptrend
Bitcoin price started a steady increase after it cleared the $42,000 resistance zone. BTC gained pace for a move above the $42,500 level and settled above the 100 hourly simple moving average.
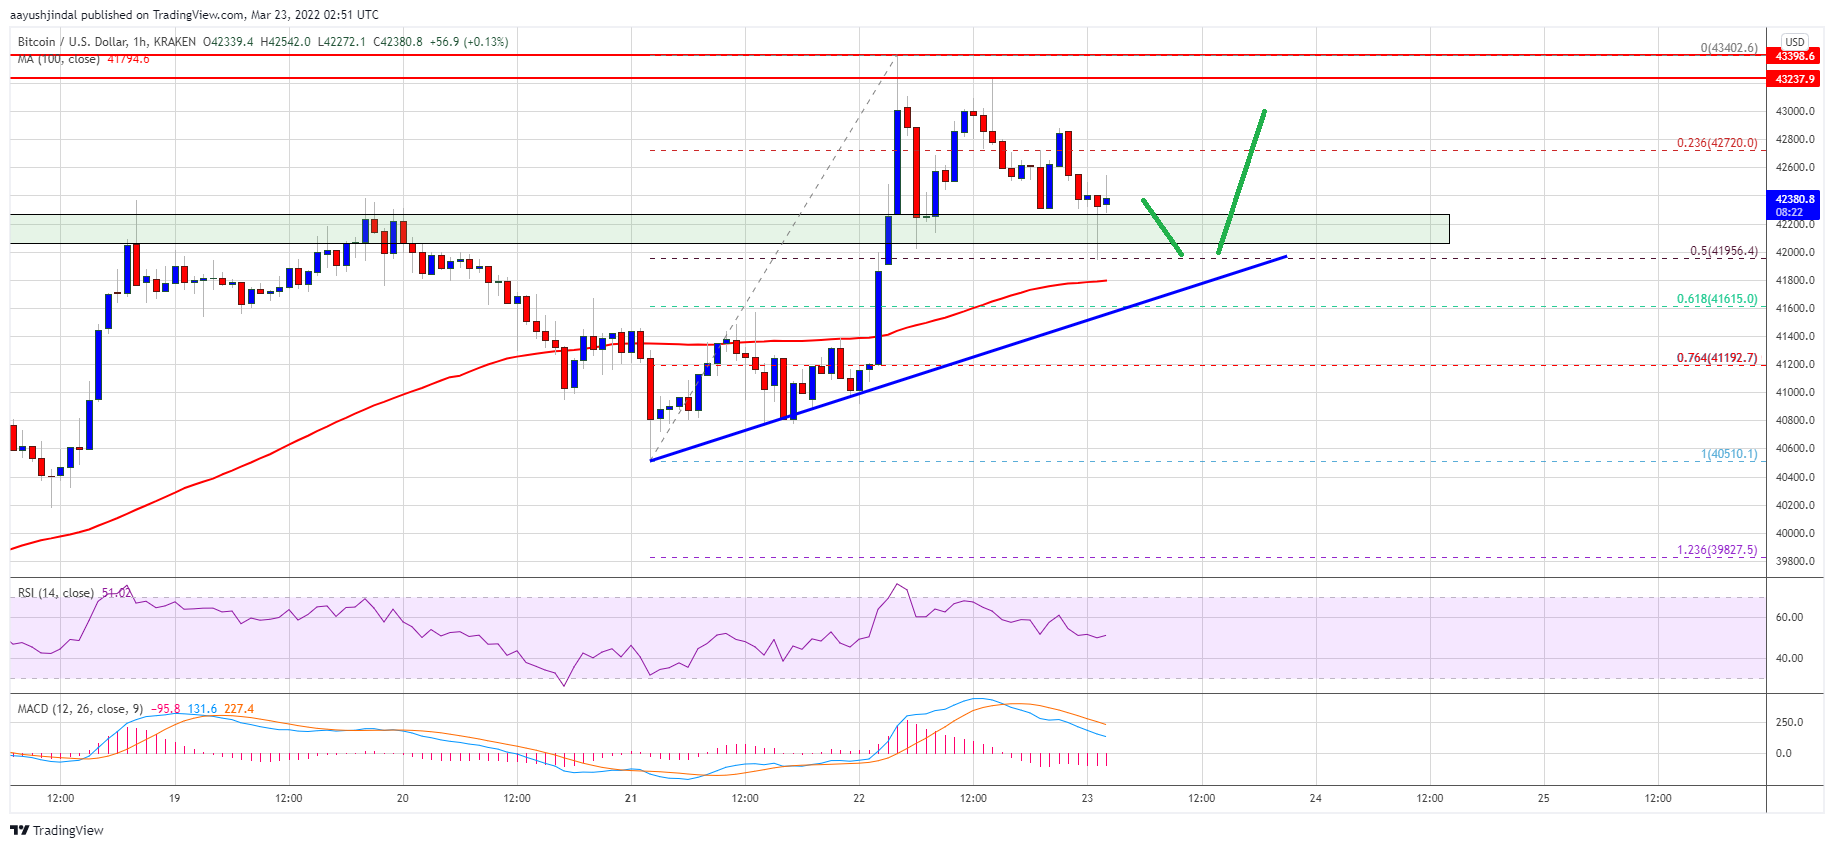
The upward move was such that the price even broke the $43,200 resistance. It traded as high as $43,402 and is currently correcting lower. There was a move below the 23.6% Fib retracement level of the recent increase from the $40,510 swing low to $43,402 high.
However, the bulls are defending the $42,000 support zone. There is also a key bullish trend line forming with support near $41,950 on the hourly chart of the BTC/USD pair. The trend line is close to the 50% Fib retracement level of the recent increase from the $40,510 swing low to $43,402 high.
On the upside, the price is facing resistance near the $42,800 level. The next major resistance could be near the $43,000 zone. A successful break and close above the $43,000 level might start another steady increase.
Source: BTCUSD on TradingView.com
In the stated case, the price might rise towards the $43,500 level. Any more gains could send the price towards the $44,200 level in the coming sessions.
Downside Break in BTC?
If bitcoin fails to clear the $43,000 resistance zone, it could correct further lower. An immediate support on the downside is near the $42,000 zone.
The next major support is seen near the trend line and the 100 hourly SMA. The main support sits near the $41,500 zone (the previous breakout zone). A downside break below the $41,500 support zone could push the price further lower towards $40,500.
Technical indicators:
Hourly MACD – The MACD is now losing pace in the bearish zone.
Hourly RSI (Relative Strength Index) – The RSI for BTC/USD is now above the 50 level.
Major Support Levels – $42,000, followed by $41,500.
Major Resistance Levels – $42,800, $43,000 and $43,500.
Bitcoin started a steady increase above the $42,000 resistance against the US Dollar. BTC tested the $43,400 zone and recently corrected lower.
Bitcoin started a downside correction after a test of $43,400.
The price is trading above $42,000 and the 100 hourly simple moving average.
There is a key bullish trend line forming with support near $41,950 on the hourly chart of the BTC/USD pair (data feed from Kraken).
The pair must stay above the $41,500 support zone to remain in a positive zone.
Bitcoin price started a steady increase after it cleared the $42,000 resistance zone. BTC gained pace for a move above the $42,500 level and settled above the 100 hourly simple moving average.
The upward move was such that the price even broke the $43,200 resistance. It traded as high as $43,402 and is currently correcting lower. There was a move below the 23.6% Fib retracement level of the recent increase from the $40,510 swing low to $43,402 high.
However, the bulls are defending the $42,000 support zone. There is also a key bullish trend line forming with support near $41,950 on the hourly chart of the BTC/USD pair. The trend line is close to the 50% Fib retracement level of the recent increase from the $40,510 swing low to $43,402 high.
On the upside, the price is facing resistance near the $42,800 level. The next major resistance could be near the $43,000 zone. A successful break and close above the $43,000 level might start another steady increase.
Source: BTCUSD on TradingView.com
In the stated case, the price might rise towards the $43,500 level. Any more gains could send the price towards the $44,200 level in the coming sessions.
If bitcoin fails to clear the $43,000 resistance zone, it could correct further lower. An immediate support on the downside is near the $42,000 zone.
The next major support is seen near the trend line and the 100 hourly SMA. The main support sits near the $41,500 zone (the previous breakout zone). A downside break below the $41,500 support zone could push the price further lower towards $40,500.
Technical indicators:
Hourly MACD – The MACD is now losing pace in the bearish zone.
Hourly RSI (Relative Strength Index) – The RSI for BTC/USD is now above the 50 level.
Major Support Levels – $42,000, followed by $41,500.
Major Resistance Levels – $42,800, $43,000 and $43,500.
Tags: bitcoinbtcusdBTCUSDTxbtusd
FeedzyRead More
A fresh infusion of liquidity from the US Treasury General Account (TGA) is making waves…
Bitcoin has been stuck for the last three months, trading between $90K and $100K. It…
Litecoin has been gaining momentum in recent weeks, and according to crypto analyst Tony “The…
Bitcoin (BTC) miners listed in the U.S. are growing their share of the network hashrate,…
Metaplanet (3350) said it bought a further 269.43 bitcoin (BTC), strengthening its position as a…
The U.S. crypto task force will focus on starting up a national bitcoin (BTC) reserve,…