TA: Bitcoin Steadies Above $43K, Why BTC Could Recover Higher
Bitcoin is consolidating losses above the $43,000 support against the US Dollar. BTC could correct higher towards the $44,275 resistance or $44,850.
Bitcoin managed to stay above the $43,000 support zone.
The price is still well below $45,000 and the 100 hourly simple moving average.
There is a key bearish trend line forming with resistance near $43,650 on the hourly chart of the BTC/USD pair (data feed from Kraken).
The pair could start an upside correction if it settles above $43,800.
Bitcoin Price Consolidates
Bitcoin price extended decline below the $45,000 support zone. BTC even spiked below the $43,000 level, but the bulls protected more downsides.
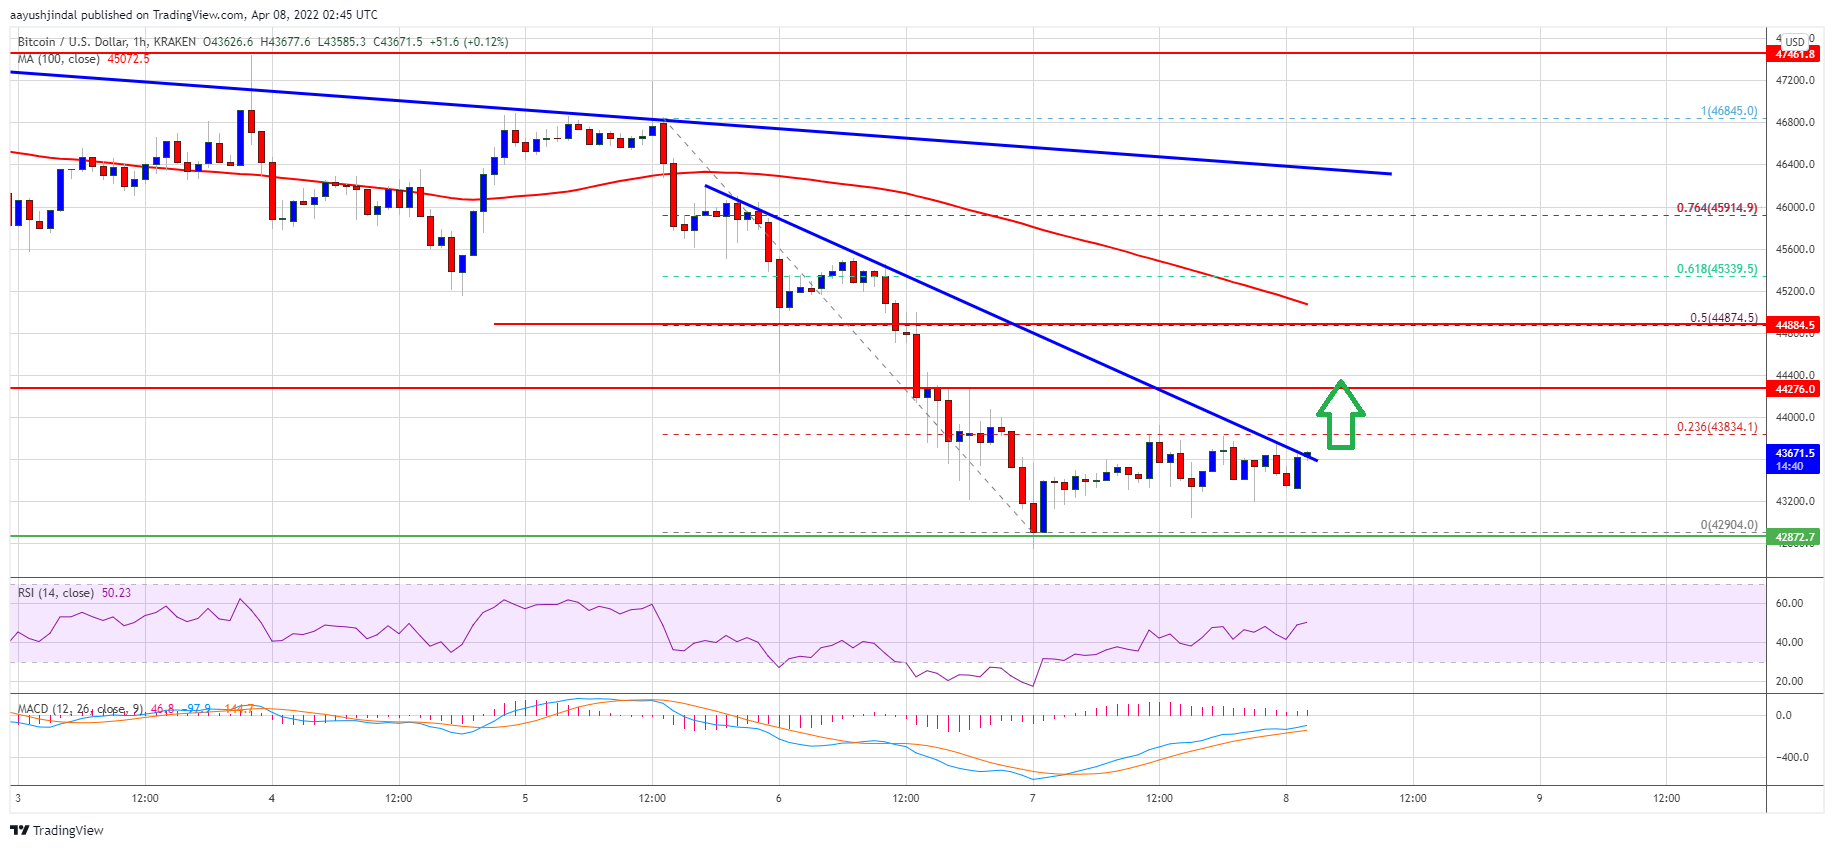
The price started trading in a range above the $43,000 level. However, it is still well below $45,000 and the 100 hourly simple moving average. It is now trading near a key bearish trend line forming with resistance near $43,650 on the hourly chart of the BTC/USD pair.
The first major barrier is near the $43,830 level. It is close to the 23.6% Fib retracement level of the key drop from the $46,845 swing high from the $42,905 low.
The next resistance could be near $44,275, where the price might struggle. If there is a move above $44,275, the price could test the $44,875 level. It is near the 50% Fib retracement level of the key drop from the $46,845 swing high from the $42,905 low.
Source: BTCUSD on TradingView.com
Bitcoin price must clear the $44,875 and $45,000 resistance levels to gain bullish momentum. In the stated case, the price may perhaps rise towards the $46,000 resistance zone. An intermediate resistance might be near the $45,500 level.
More Losses in BTC?
If bitcoin fails to clear the $44,875 resistance zone, it could continue to move down. An immediate support on the downside is near the $43,000 level.
The next major support is seen near the $42,900 level or the recent low. A downside break below the $42,900 support zone could accelerate losses. In the stated case, the price could drop towards the $42,200 support in the near term. The next major support might be $42,000.
Technical indicators:
Hourly MACD – The MACD is now gaining pace in the bullish zone.
Hourly RSI (Relative Strength Index) – The RSI for BTC/USD is now above the 50 level.
Major Support Levels – $43,000, followed by $42,000.
Major Resistance Levels – $43,875, $44,000 and $45,000.
Bitcoin is consolidating losses above the $43,000 support against the US Dollar. BTC could correct higher towards the $44,275 resistance or $44,850.
Bitcoin managed to stay above the $43,000 support zone.
The price is still well below $45,000 and the 100 hourly simple moving average.
There is a key bearish trend line forming with resistance near $43,650 on the hourly chart of the BTC/USD pair (data feed from Kraken).
The pair could start an upside correction if it settles above $43,800.
Bitcoin Price Consolidates
Bitcoin price extended decline below the $45,000 support zone. BTC even spiked below the $43,000 level, but the bulls protected more downsides.
The price started trading in a range above the $43,000 level. However, it is still well below $45,000 and the 100 hourly simple moving average. It is now trading near a key bearish trend line forming with resistance near $43,650 on the hourly chart of the BTC/USD pair.
The first major barrier is near the $43,830 level. It is close to the 23.6% Fib retracement level of the key drop from the $46,845 swing high from the $42,905 low.
The next resistance could be near $44,275, where the price might struggle. If there is a move above $44,275, the price could test the $44,875 level. It is near the 50% Fib retracement level of the key drop from the $46,845 swing high from the $42,905 low.
Source: BTCUSD on TradingView.com
Bitcoin price must clear the $44,875 and $45,000 resistance levels to gain bullish momentum. In the stated case, the price may perhaps rise towards the $46,000 resistance zone. An intermediate resistance might be near the $45,500 level.
More Losses in BTC?
If bitcoin fails to clear the $44,875 resistance zone, it could continue to move down. An immediate support on the downside is near the $43,000 level.
The next major support is seen near the $42,900 level or the recent low. A downside break below the $42,900 support zone could accelerate losses. In the stated case, the price could drop towards the $42,200 support in the near term. The next major support might be $42,000.
Technical indicators:
Hourly MACD – The MACD is now gaining pace in the bullish zone.
Hourly RSI (Relative Strength Index) – The RSI for BTC/USD is now above the 50 level.
Major Support Levels – $43,000, followed by $42,000.
Major Resistance Levels – $43,875, $44,000 and $45,000.
Tags: bitcoinbtcusdBTCUSDTxbtusd
FeedzyRead More


Recent Posts
Bitcoin Hits 6-Month High In Active Addresses: Is $100K The Next Target?
Bitcoin bulls are trying to push higher from just under $97,000, attempting to confirm its…
Analyst Identifies When Bitcoin Price Will Reach Cycle Top — Here’s The Timeline
The Bitcoin price appeared to have reached its top in this current cycle, embarking on…
Bitcoin Traders’ Favorite Lottery Ticket for the First Half of the Year — The $300K BTC Call
In the crypto market, bold predictions aren’t just talk - they’re backed by real dollars,…
Chart of the Week: ’10x Money Multiplier’ for Bitcoin Could Take Wall Street by Storm
Adopting Michael Saylor's strategy of buying for the balance sheet has clearly taken off among…
Bitcoin Spot ETFs Score $1.81 Billion In Net Inflows As Market Revival Continues
The US Bitcoin ETFs are strongly reflecting the bullish sentiments that are ravaging the crypto…
Bitcoin At $100K? $3 Billion In Shorts Are On The Line
Bitcoin is red hot again. Price reached $97,500 before dipping slightly lower to $97,000, and…