Bitcoin attempted a recovery wave above $32,000 against the US Dollar. BTC is struggling and remains at a risk of more losses below $30,000.
Bitcoin started a short-term recovery wave after it tested the $30,000 zone.
The price is now trading below $31,500 and the 100 hourly simple moving average.
There is a major bearish trend line forming with resistance near $31,400 on the hourly chart of the BTC/USD pair (data feed from Kraken).
The pair might resume decline if it stays below the $32,400 resistance zone.
Bitcoin Price Faces Hurdles
Bitcoin price extended downsides below the $32,000 level. BTC even tested the $30,000 support zone and traded as low as $29,755.
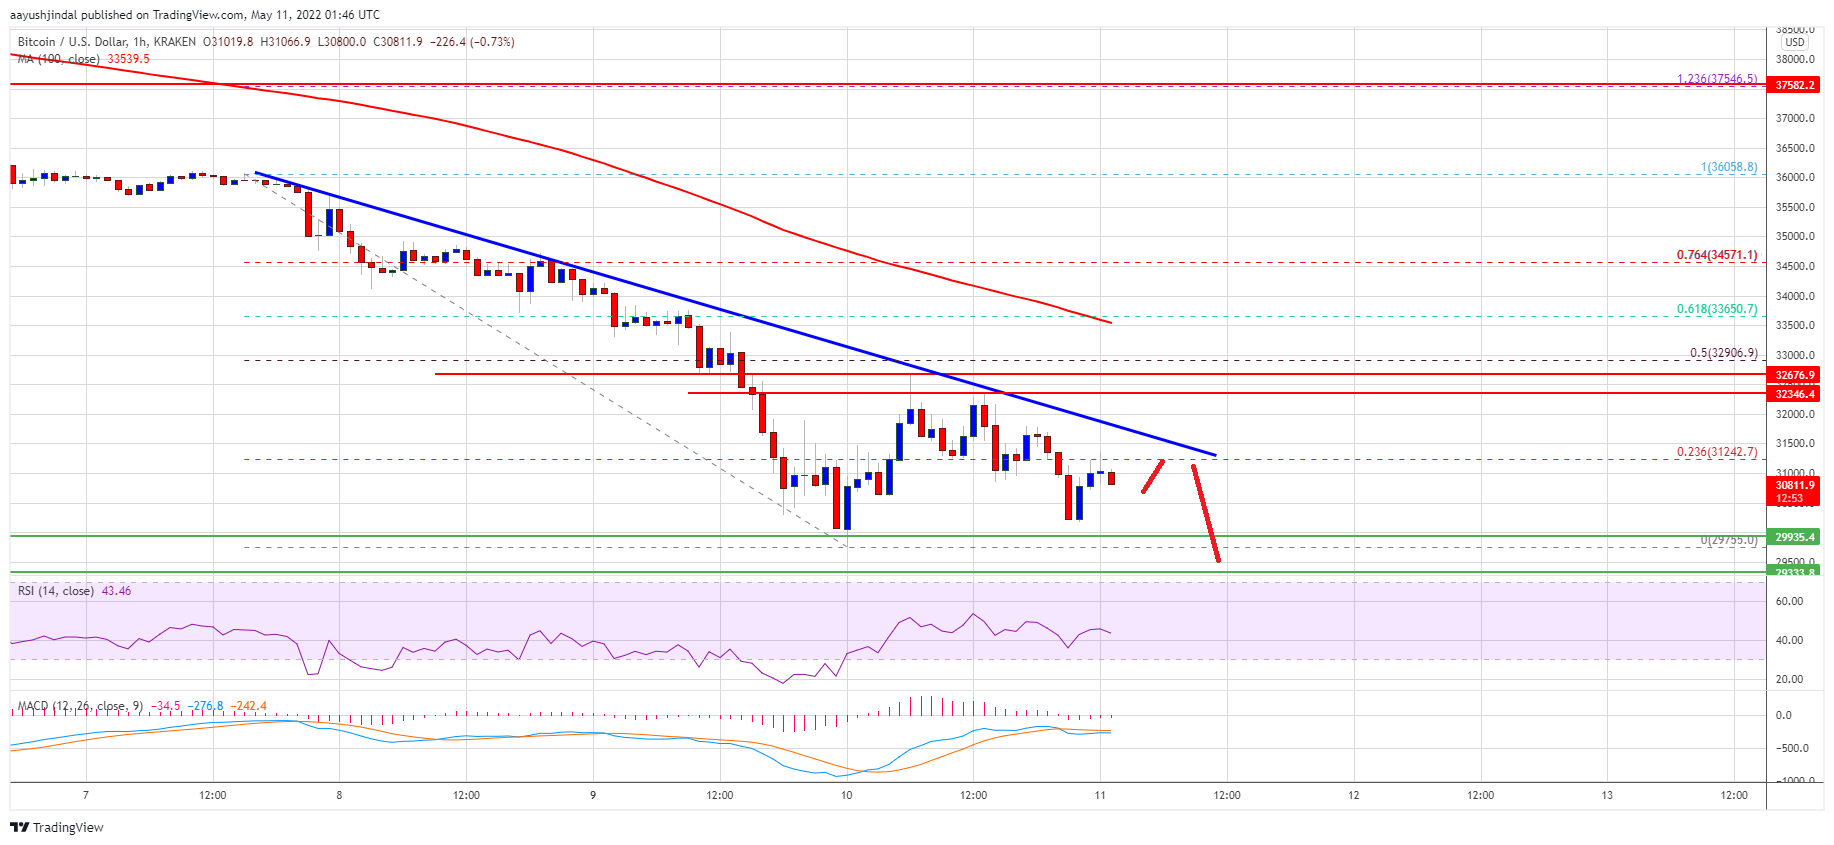
Recently, there was an upside correction above the $31,000 level. The price was able to climb above the 23.6% Fib retracement level of the key drop from the $36,059 swing high to $29,755 low. The bulls were able to push the price above the $32,000 resistance.
However, they faced a strong resistance near the $32,650 zone. Bitcoin remained below the 50% Fib retracement level of the key drop from the $36,059 swing high to $29,755 low.
The price is now trading below $31,500 and the 100 hourly simple moving average. There is also a major bearish trend line forming with resistance near $31,400 on the hourly chart of the BTC/USD pair. On the upside, bitcoin price is facing resistance near the $31,250 level.
Source: BTCUSD on TradingView.com
The next key resistance could be near the $31,400 level. The key breakout zone could be near the $32,650 zone. A clear move above the $32,400 and $32,650 levels might start a steady increase in the near term.
More Losses in BTC?
If bitcoin fails to clear the $32,400 resistance zone, it could continue to move down. An immediate support on the downside is near the $30,500 level.
The next major support is seen near the $30,000 level. A downside break and close below the $30,000 support might start another decline. The next major support could be $29,500, below which the bears might aim a move towards the $28,800 support zone.
Technical indicators:
Hourly MACD – The MACD is now gaining pace in the bearish zone.
Hourly RSI (Relative Strength Index) – The RSI for BTC/USD is now below the 50 level.
Major Support Levels – $30,500, followed by $30,000.
Major Resistance Levels – $31,250, $32,400 and $32,650.
Bitcoin attempted a recovery wave above $32,000 against the US Dollar. BTC is struggling and remains at a risk of more losses below $30,000.
Bitcoin started a short-term recovery wave after it tested the $30,000 zone.
The price is now trading below $31,500 and the 100 hourly simple moving average.
There is a major bearish trend line forming with resistance near $31,400 on the hourly chart of the BTC/USD pair (data feed from Kraken).
The pair might resume decline if it stays below the $32,400 resistance zone.
Bitcoin price extended downsides below the $32,000 level. BTC even tested the $30,000 support zone and traded as low as $29,755.
Recently, there was an upside correction above the $31,000 level. The price was able to climb above the 23.6% Fib retracement level of the key drop from the $36,059 swing high to $29,755 low. The bulls were able to push the price above the $32,000 resistance.
However, they faced a strong resistance near the $32,650 zone. Bitcoin remained below the 50% Fib retracement level of the key drop from the $36,059 swing high to $29,755 low.
The price is now trading below $31,500 and the 100 hourly simple moving average. There is also a major bearish trend line forming with resistance near $31,400 on the hourly chart of the BTC/USD pair. On the upside, bitcoin price is facing resistance near the $31,250 level.
Source: BTCUSD on TradingView.com
The next key resistance could be near the $31,400 level. The key breakout zone could be near the $32,650 zone. A clear move above the $32,400 and $32,650 levels might start a steady increase in the near term.
If bitcoin fails to clear the $32,400 resistance zone, it could continue to move down. An immediate support on the downside is near the $30,500 level.
The next major support is seen near the $30,000 level. A downside break and close below the $30,000 support might start another decline. The next major support could be $29,500, below which the bears might aim a move towards the $28,800 support zone.
Technical indicators:
Hourly MACD – The MACD is now gaining pace in the bearish zone.
Hourly RSI (Relative Strength Index) – The RSI for BTC/USD is now below the 50 level.
Major Support Levels – $30,500, followed by $30,000.
Major Resistance Levels – $31,250, $32,400 and $32,650.
Tags: bitcoinbtcusdBTCUSDTxbtusd
FeedzyRead More
Since early 2023, Bitcoin (BTC) has chalked out a classic stairstep bull run, characterized by…
Bitcoin (BTC) mining company Bitdeer announced today that it had acquired a 101-MW gas-fired power…
Bitcoin (BTC) enjoyed a brief sigh of relief yesterday as the US delayed its proposed…
Bitcoin price performance over the past week has been marked by volatility and mixed signals…
Bitcoin price started another decline from the $102,500 zone. BTC is trimming gains and struggling…
Bitcoin and the entire crypto market experienced a rollercoaster of volatility yesterday, plunging on fears…