TA: Bitcoin Tops Near $47K, Why The Bulls Must Defend $45K
Bitcoin struggled to gain momentum above $47,000 against the US Dollar. BTC started a fresh decline and dived to the $45,000 support zone.
Bitcoin reacted to the downside after it formed a short-term top near $47,000.
The price is trading below $46,000 and the 100 hourly simple moving average.
There is a key bearish trend line forming with resistance near $46,600 on the hourly chart of the BTC/USD pair (data feed from Kraken).
The pair must stay above the $45,000 support to avoid more downsides in the near term.
Bitcoin Price Trims Gains
Bitcoin price made another attempt to gain momentum above the $47,000 resistance zone. However, BTC failed to continue higher above $47,000 and reacted the downside.
There was a downside break below the $46,000 support level and the 100 hourly simple moving average. The price declined below the $45,500 support to move into a short-term bearish zone. However, the bulls are now defending the $45,000 support zone.
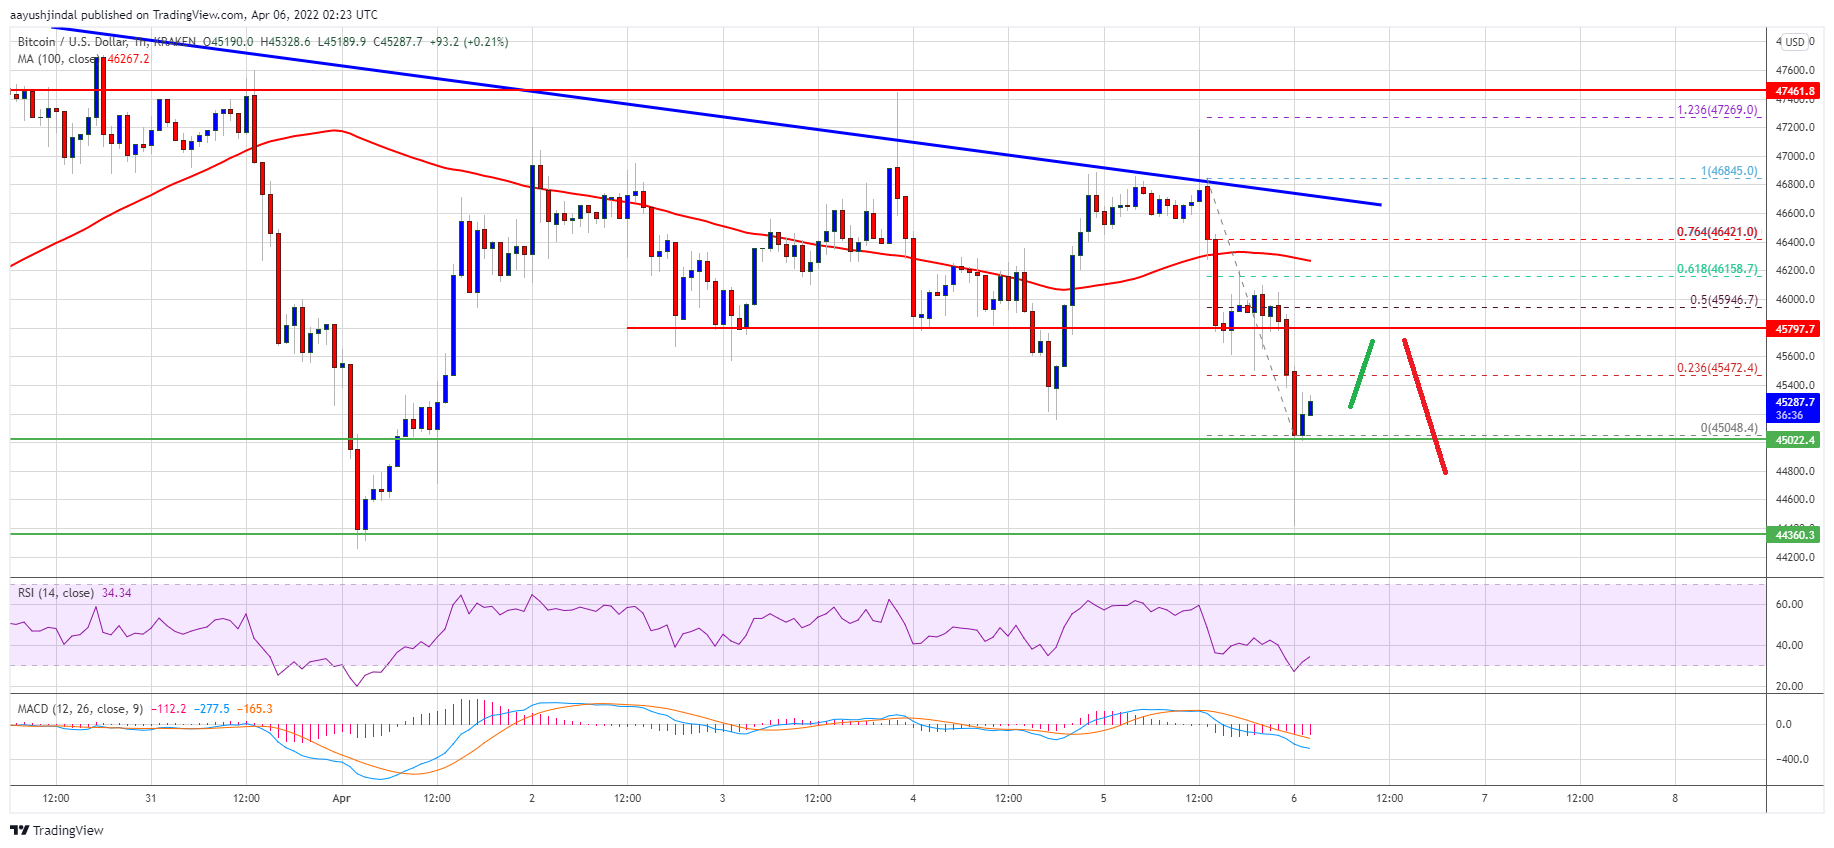
A low is formed near $45,048 and the price is now consolidating. On the upside, an immediate resistance is near the $45,450 level. It is near the 23.6% Fib retracement level of the recent decline from the $46,845 swing high from the $45,048 low.
The next resistance could be near $45,800 or $45,900. The 50% Fib retracement level of the recent decline from the $46,845 swing high from the $45,048 low is also near the $49,950 level.
Source: BTCUSD on TradingView.com
Besides, there is a key bearish trend line forming with resistance near $46,600 on the hourly chart of the BTC/USD pair. Bitcoin price must clear the $46,000 and $46,600 resistance levels to gain bullish momentum in the near term.
More Losses in BTC?
If bitcoin fails to clear the $46,000 resistance zone, it could continue to move down. An immediate support on the downside is near the $45,200 level.
The next major support is seen near the $45,000 level. A downside break below the $45,000 support zone could start a major decline. In the stated case, the price could even decline to $44,360 in the near term. The next major support might be $44,000.
Technical indicators:
Hourly MACD – The MACD is slowly losing pace in the bearish zone.
Hourly RSI (Relative Strength Index) – The RSI for BTC/USD is well below the 50 level.
Major Support Levels – $45,200, followed by $45,000.
Major Resistance Levels – $45,450, $46,000 and $46,600.
Bitcoin struggled to gain momentum above $47,000 against the US Dollar. BTC started a fresh decline and dived to the $45,000 support zone.
Bitcoin reacted to the downside after it formed a short-term top near $47,000.
The price is trading below $46,000 and the 100 hourly simple moving average.
There is a key bearish trend line forming with resistance near $46,600 on the hourly chart of the BTC/USD pair (data feed from Kraken).
The pair must stay above the $45,000 support to avoid more downsides in the near term.
Bitcoin Price Trims Gains
Bitcoin price made another attempt to gain momentum above the $47,000 resistance zone. However, BTC failed to continue higher above $47,000 and reacted the downside.
There was a downside break below the $46,000 support level and the 100 hourly simple moving average. The price declined below the $45,500 support to move into a short-term bearish zone. However, the bulls are now defending the $45,000 support zone.
A low is formed near $45,048 and the price is now consolidating. On the upside, an immediate resistance is near the $45,450 level. It is near the 23.6% Fib retracement level of the recent decline from the $46,845 swing high from the $45,048 low.
The next resistance could be near $45,800 or $45,900. The 50% Fib retracement level of the recent decline from the $46,845 swing high from the $45,048 low is also near the $49,950 level.
Source: BTCUSD on TradingView.com
Besides, there is a key bearish trend line forming with resistance near $46,600 on the hourly chart of the BTC/USD pair. Bitcoin price must clear the $46,000 and $46,600 resistance levels to gain bullish momentum in the near term.
More Losses in BTC?
If bitcoin fails to clear the $46,000 resistance zone, it could continue to move down. An immediate support on the downside is near the $45,200 level.
The next major support is seen near the $45,000 level. A downside break below the $45,000 support zone could start a major decline. In the stated case, the price could even decline to $44,360 in the near term. The next major support might be $44,000.
Technical indicators:
Hourly MACD – The MACD is slowly losing pace in the bearish zone.
Hourly RSI (Relative Strength Index) – The RSI for BTC/USD is well below the 50 level.
Major Support Levels – $45,200, followed by $45,000.
Major Resistance Levels – $45,450, $46,000 and $46,600.
Tags: bitcoinbtcusdBTCUSDTxbtusd
FeedzyRead More


Recent Posts
Bitcoin Hits New Heights: Analyst Predicts Next Peak By Late 2025
As Bitcoin (BTC) continues to capture investor enthusiasm, recently reaching a new all-time high of…
Crypto Daybook Americas: Bitcoin Dominance Tops 64% While Options Indicate Bullish Tilt
By James Van Straten (All times ET unless indicated otherwise) Since May 22, bitcoin (BTC)…
GameStop Purchases Over $500M Worth of Bitcoin
Video game retailer GameStop (GME) has purchased 4,710 bitcoin, worth nearly $513 million at the…
Ether Favored Over Bitcoin by Big Money, Here Are 3 Clues That Point to ETH Bias in Crypto Market
The futures and options market, a proxy for big money, is increasingly backing ether ETH…
Bitcoin Could Explode On Bessent’s $250 Billion Deregulation Shock
US Treasury Secretary Scott Bessent has signalled that the long-debated overhaul of banks’ supplementary leverage…
GameStop Buys $513 Million Worth of Bitcoin
Bitcoin Magazine GameStop Buys $513 Million Worth of Bitcoin Video game retailer GameStop has purchased…