Bitcoin extended gains above $42,500 against the US Dollar. BTC struggled near $43,000 and started a sharp downside correction.
Bitcoin started another decline after it failed to clear the $43,000 resistance zone.
The price is now trading below $41,000 and the 100 hourly simple moving average.
There was a break below a major bullish trend line with support near $41,250 on the hourly chart of the BTC/USD pair (data feed from Kraken).
The pair could attempt a fresh increase, but the $41,000 resistance holds the key.
Bitcoin Price Dips
Bitcoin price remained well bid above the $41,500 resistance zone. BTC gained pace and cleared the $42,000 resistance zone. It even moved above $42,500 and the 100 hourly simple moving average.
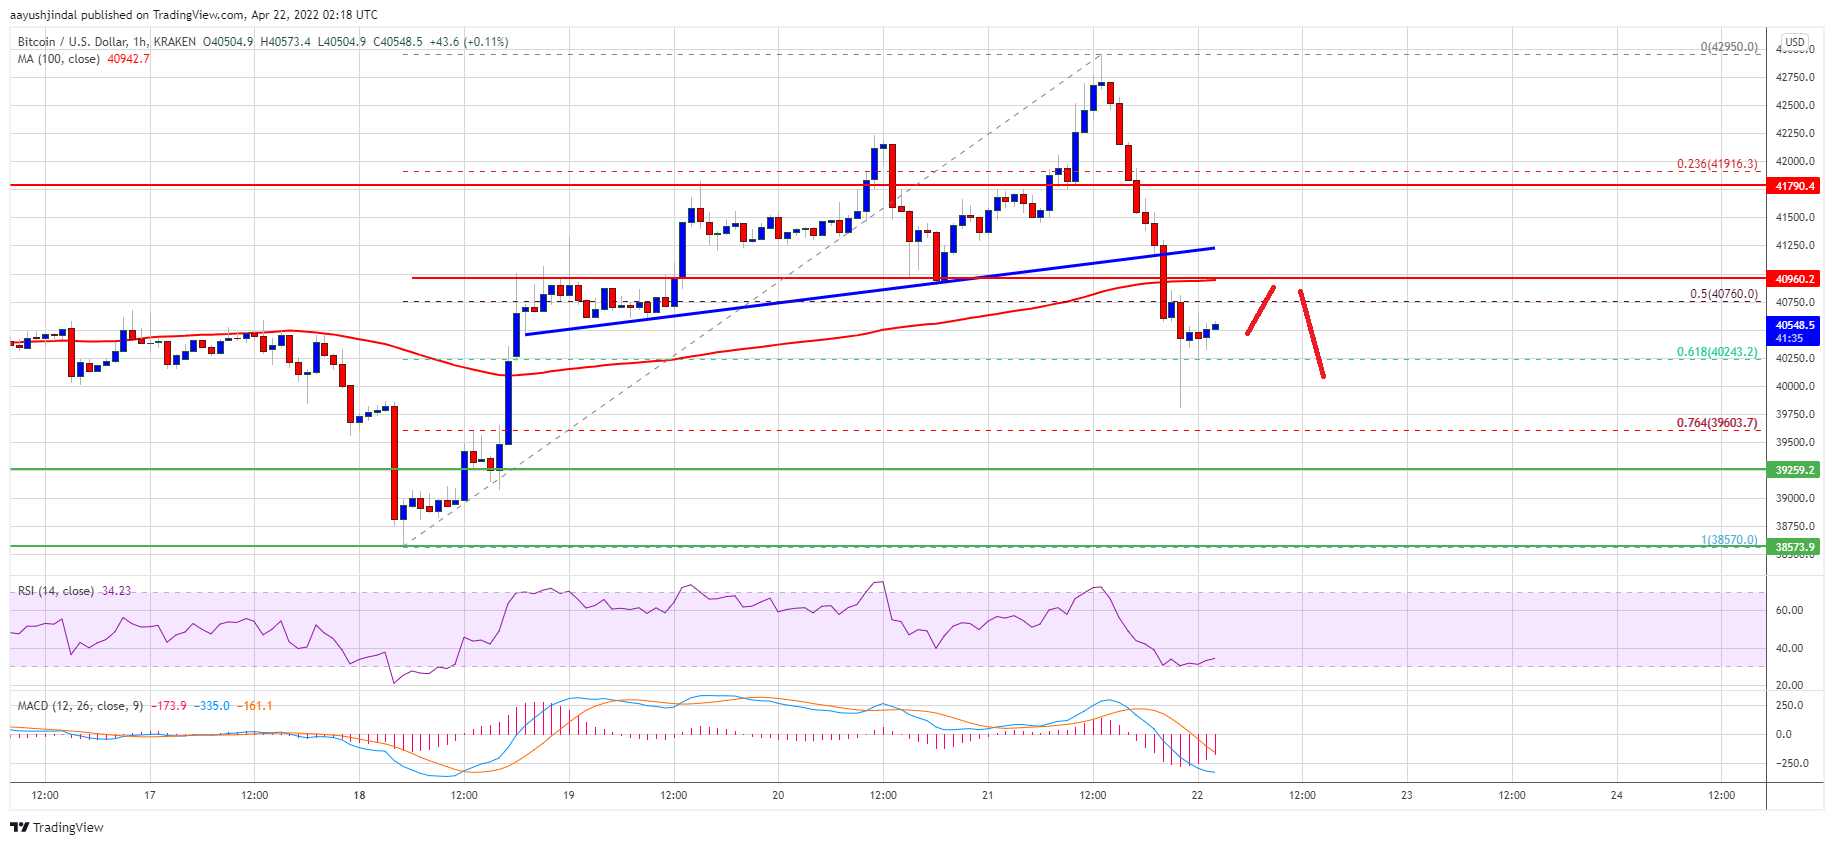
However, the bulls failed to push the price above the $43,000 level. A high was formed near $42,950 and the price reacted to the downside. There was a sharp move below the $42,000 level. Besides, there was a break below a major bullish trend line with support near $41,250 on the hourly chart of the BTC/USD pair.
There was a break below the 50% Fib retracement level of the upward move from the $38,750 swing low to $42,950 high. Bitcoin is now trading below $41,000 and the 100 hourly simple moving average.
The price is now consolidating above the 61.8% Fib retracement level of the upward move from the $38,750 swing low to $42,950 high. An immediate resistance on the upside is near the $40,750 level. The next key resistance could be $40,950 and the 100 hourly simple moving average.
Source: BTCUSD on TradingView.com
To start a strong upward move, the price must settle above the $41,000 zone and the 100 hourly simple moving average. If the bulls succeed, the price could rise towards the $41,800 resistance zone.
More Losses in BTC?
If bitcoin fails to clear the $41,000 resistance zone, it could continue to move down. An immediate support on the downside is near the $40,250 level.
The next major support is seen near the $40,000 level. A downside break below the $40,000 zone could send the price towards the $39,250 support zone.
Technical indicators:
Hourly MACD – The MACD is slowly losing pace in the bearish zone.
Hourly RSI (Relative Strength Index) – The RSI for BTC/USD is now below the 50 level.
Major Support Levels – $40,250, followed by $40,000.
Major Resistance Levels – $40,750, $41,000 and $41,800.
Bitcoin extended gains above $42,500 against the US Dollar. BTC struggled near $43,000 and started a sharp downside correction.
Bitcoin started another decline after it failed to clear the $43,000 resistance zone.
The price is now trading below $41,000 and the 100 hourly simple moving average.
There was a break below a major bullish trend line with support near $41,250 on the hourly chart of the BTC/USD pair (data feed from Kraken).
The pair could attempt a fresh increase, but the $41,000 resistance holds the key.
Bitcoin price remained well bid above the $41,500 resistance zone. BTC gained pace and cleared the $42,000 resistance zone. It even moved above $42,500 and the 100 hourly simple moving average.
However, the bulls failed to push the price above the $43,000 level. A high was formed near $42,950 and the price reacted to the downside. There was a sharp move below the $42,000 level. Besides, there was a break below a major bullish trend line with support near $41,250 on the hourly chart of the BTC/USD pair.
There was a break below the 50% Fib retracement level of the upward move from the $38,750 swing low to $42,950 high. Bitcoin is now trading below $41,000 and the 100 hourly simple moving average.
The price is now consolidating above the 61.8% Fib retracement level of the upward move from the $38,750 swing low to $42,950 high. An immediate resistance on the upside is near the $40,750 level. The next key resistance could be $40,950 and the 100 hourly simple moving average.
Source: BTCUSD on TradingView.com
To start a strong upward move, the price must settle above the $41,000 zone and the 100 hourly simple moving average. If the bulls succeed, the price could rise towards the $41,800 resistance zone.
If bitcoin fails to clear the $41,000 resistance zone, it could continue to move down. An immediate support on the downside is near the $40,250 level.
The next major support is seen near the $40,000 level. A downside break below the $40,000 zone could send the price towards the $39,250 support zone.
Technical indicators:
Hourly MACD – The MACD is slowly losing pace in the bearish zone.
Hourly RSI (Relative Strength Index) – The RSI for BTC/USD is now below the 50 level.
Major Support Levels – $40,250, followed by $40,000.
Major Resistance Levels – $40,750, $41,000 and $41,800.
Tags: bitcoinbtcusdBTCUSDTxbtusd
FeedzyRead More
Alexander Vinnik, the jailed former operator of once mighty bitcoin exchange BTC-e, is being released…
Founder: Nicolas Burtey Date Founded: September 2019 Location of Headquarters: United States Number of Employees:…
Bitcoin Twitter (or Bitcoin X) is having a moment after a 13F filing by Goldman…
After a relatively subdued price performance in 2024, Ethereum (ETH) could be on the verge…
In El Salvador, about two hours away from the capital, up in the mountains, lies…
Bitcoin has experienced a challenging period recently, with its price consistently declining over the past…