TA: Bitcoin Turns Bearish, Bears In Control Below $40K
Bitcoin started a strong decline below the $40,000 support against the US Dollar. BTC might recover, but upsides might be limited above $38,000.
Bitcoin started a major decline below the $40,000 and $38,000 support levels.
The price is now trading below $38,000 and the 100 hourly simple moving average.
There is a key bearish trend line with resistance near $36,500 on the hourly chart of the BTC/USD pair (data feed from Kraken).
The pair could continue to move down if there is a break below the $34,000 support.
Bitcoin Price Extends Losses
Bitcoin price started a major decline below the $42,000 and $40,000 support levels. BTC gained pace below the $38,000 level to move further into a bearish zone.
It traded as low as $34,007 and is currently consolidating losses. It is now trading below $38,000 and the 100 hourly simple moving average.
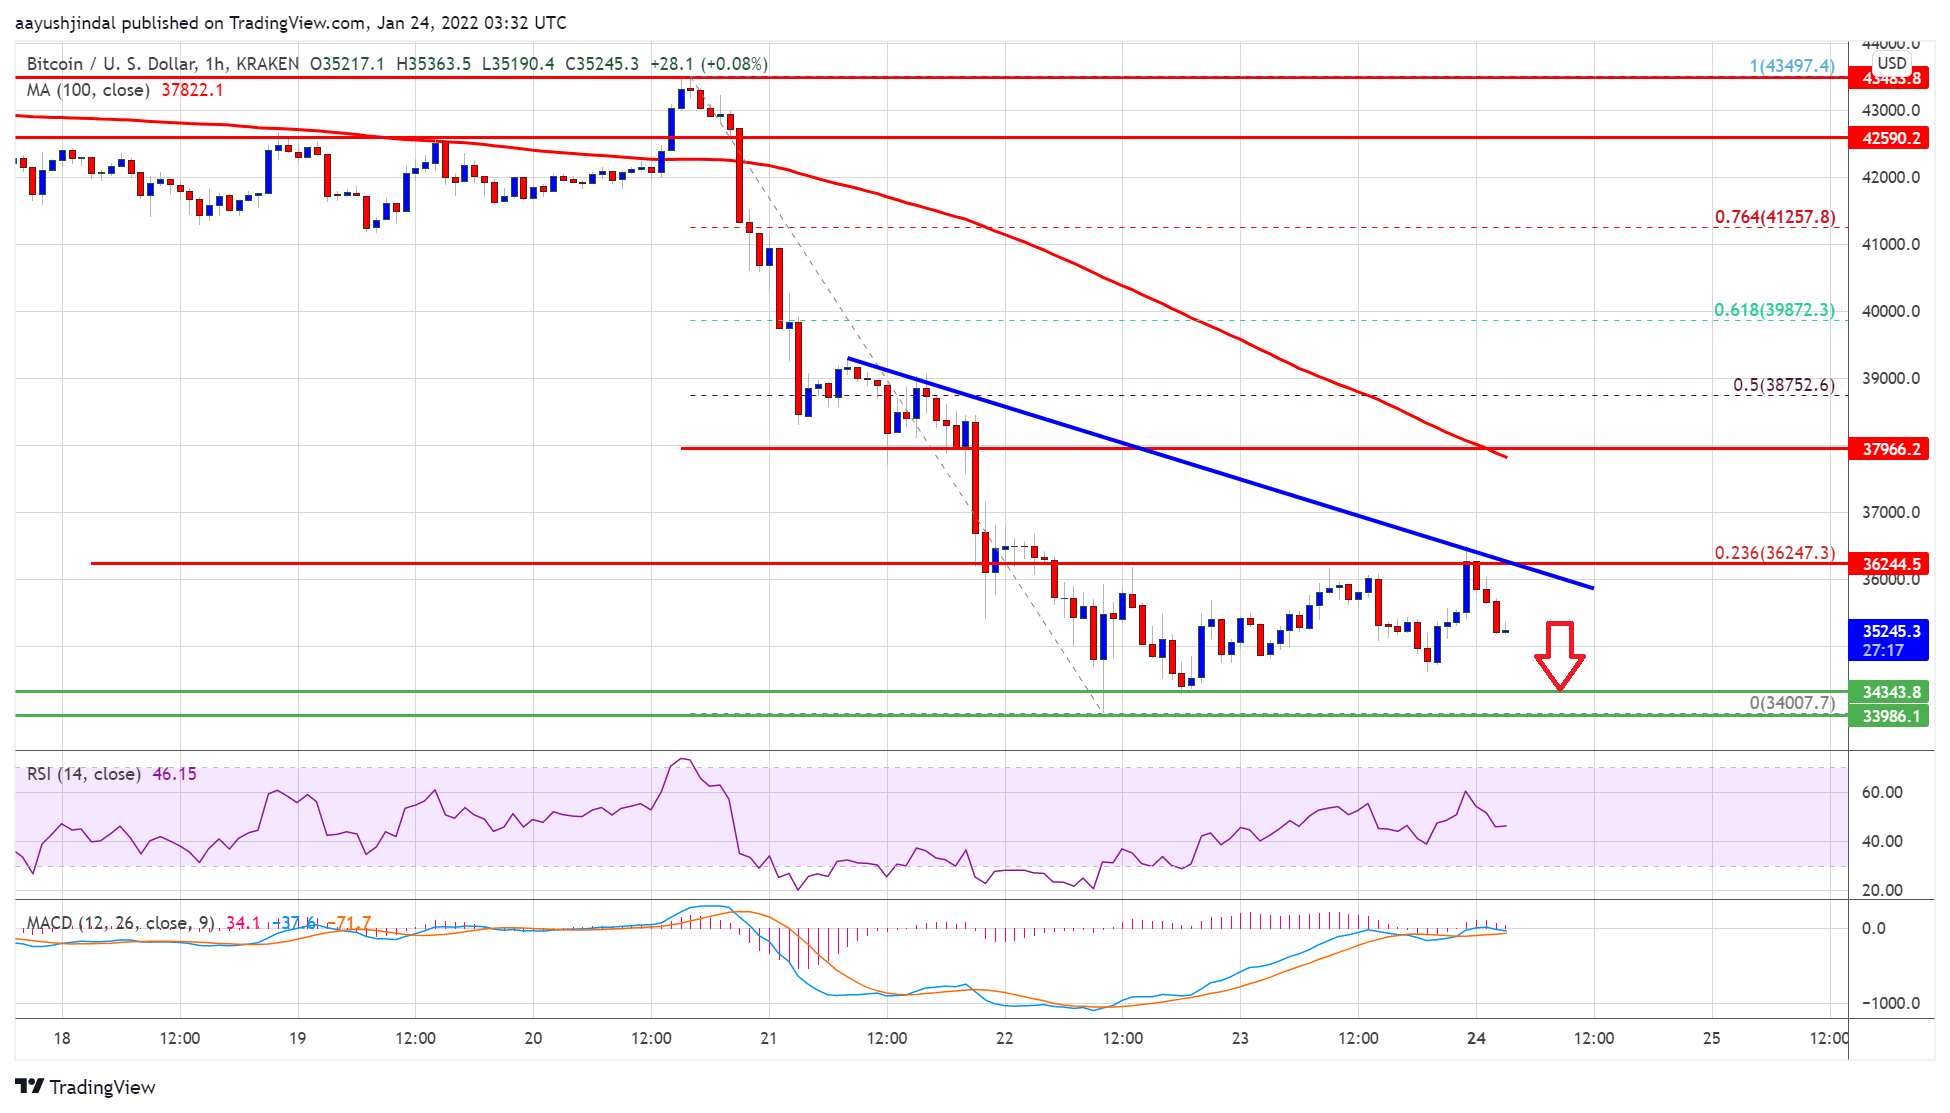
On the upside, an initial resistance is near the $36,200 level. There is also a key bearish trend line with resistance near $36,500 on the hourly chart of the BTC/USD pair. The trend line is near the 23.6% Fib retracement level of the recent decline from the $43,500 swing high to $34,007 low.
The first major resistance is near the $36,800 level. An upside break above the $36,800 resistance could start a steady recovery wave towards $38,000. The next key resistance is near the $40,000 level, above which the bulls might aim a test of $41,200.
Source: BTCUSD on TradingView.com
An intermediate resistance is near the 50% Fib retracement level of the recent decline from the $43,500 swing high to $34,007 low. Any more gains may perhaps call for a move towards the $42,500 resistance zone.
More Losses in BTC?
If bitcoin fails to start a fresh increase above $36,500, it could start another decline. An immediate support on the downside is near the $34,500 zone.
The first major support is seen near the $34,000 zone. A downside break below the $34,000 support zone may perhaps spark another major decline. The next major support is near $32,500, below which the price could even decline below the $32,000 zone.
Technical indicators:
Hourly MACD – The MACD is now gaining pace in the bearish zone.
Hourly RSI (Relative Strength Index) – The RSI for BTC/USD is well below the 50 level.
Major Support Levels – $34,500, followed by $34,000.
Major Resistance Levels – $36,250, $36,500 and $38,000.
Bitcoin started a strong decline below the $40,000 support against the US Dollar. BTC might recover, but upsides might be limited above $38,000.
Bitcoin started a major decline below the $40,000 and $38,000 support levels.
The price is now trading below $38,000 and the 100 hourly simple moving average.
There is a key bearish trend line with resistance near $36,500 on the hourly chart of the BTC/USD pair (data feed from Kraken).
The pair could continue to move down if there is a break below the $34,000 support.
Bitcoin Price Extends Losses
Bitcoin price started a major decline below the $42,000 and $40,000 support levels. BTC gained pace below the $38,000 level to move further into a bearish zone.
It traded as low as $34,007 and is currently consolidating losses. It is now trading below $38,000 and the 100 hourly simple moving average.
On the upside, an initial resistance is near the $36,200 level. There is also a key bearish trend line with resistance near $36,500 on the hourly chart of the BTC/USD pair. The trend line is near the 23.6% Fib retracement level of the recent decline from the $43,500 swing high to $34,007 low.
The first major resistance is near the $36,800 level. An upside break above the $36,800 resistance could start a steady recovery wave towards $38,000. The next key resistance is near the $40,000 level, above which the bulls might aim a test of $41,200.
Source: BTCUSD on TradingView.com
An intermediate resistance is near the 50% Fib retracement level of the recent decline from the $43,500 swing high to $34,007 low. Any more gains may perhaps call for a move towards the $42,500 resistance zone.
More Losses in BTC?
If bitcoin fails to start a fresh increase above $36,500, it could start another decline. An immediate support on the downside is near the $34,500 zone.
The first major support is seen near the $34,000 zone. A downside break below the $34,000 support zone may perhaps spark another major decline. The next major support is near $32,500, below which the price could even decline below the $32,000 zone.
Technical indicators:
Hourly MACD – The MACD is now gaining pace in the bearish zone.
Hourly RSI (Relative Strength Index) – The RSI for BTC/USD is well below the 50 level.
Major Support Levels – $34,500, followed by $34,000.
Major Resistance Levels – $36,250, $36,500 and $38,000.
Tags: bitcoinbtcusdBTCUSDTxbtusd
FeedzyRead More


Recent Posts
Bitcoin Price Suppression Below $100,000 Worries Investors, JPMorgan Analysts Reveal Real Problem
Bitcoin’s price rally may be under threat as it continues to trade under $100,000. According…
Bitcoin Bearish Case Emerges – Is A Dump To $73,000 Coming?
A new technical analysis on TradingView suggests Bitcoin may be approaching a decisive moment, with…
Bitcoin’s Bullish Case Hinges On $94,645 Support: Will Buyers Step In?
The Bitcoin market continued to struggle in February marked by a high level of investor…
Bitcoin Faces Serious Price Compression – What Happened Last Time
Bitcoin has experienced a tiring price action in recent weeks, with the price struggling to…
Bitcoin’s Grip Tightens — CZ Says There’s ‘No Escape’ From Crypto
A former cryptocurrency exchange executive remarked that Bitcoin is an inescapable reality, a statement that…
As Bitcoin Sell Pressure Fades, Could A Local Bottom Be Forming? Analyst Explains
According to an X post by crypto analyst Ali Martinez, Bitcoin (BTC) is witnessing a…