Bitcoin is consolidating below the $48,000 resistance against the US Dollar. BTC could start a fresh rally if it clears the $48,000 resistance zone.
Bitcoin is stable above the $47,000 and $46,800 support levels.
The price is trading above $46,500 and the 100 hourly simple moving average.
There is a major breakout pattern forming with resistance near $47,700 on the hourly chart of the BTC/USD pair (data feed from Kraken).
The pair could start a fresh increase if it manages to clear the $48,000 resistance zone.
Bitcoin Price Eyes Fresh Increase
Bitcoin price started a minor downside correction after it failed near the $48,200 level. BTC corrected lower and traded below the $47,800 support level.
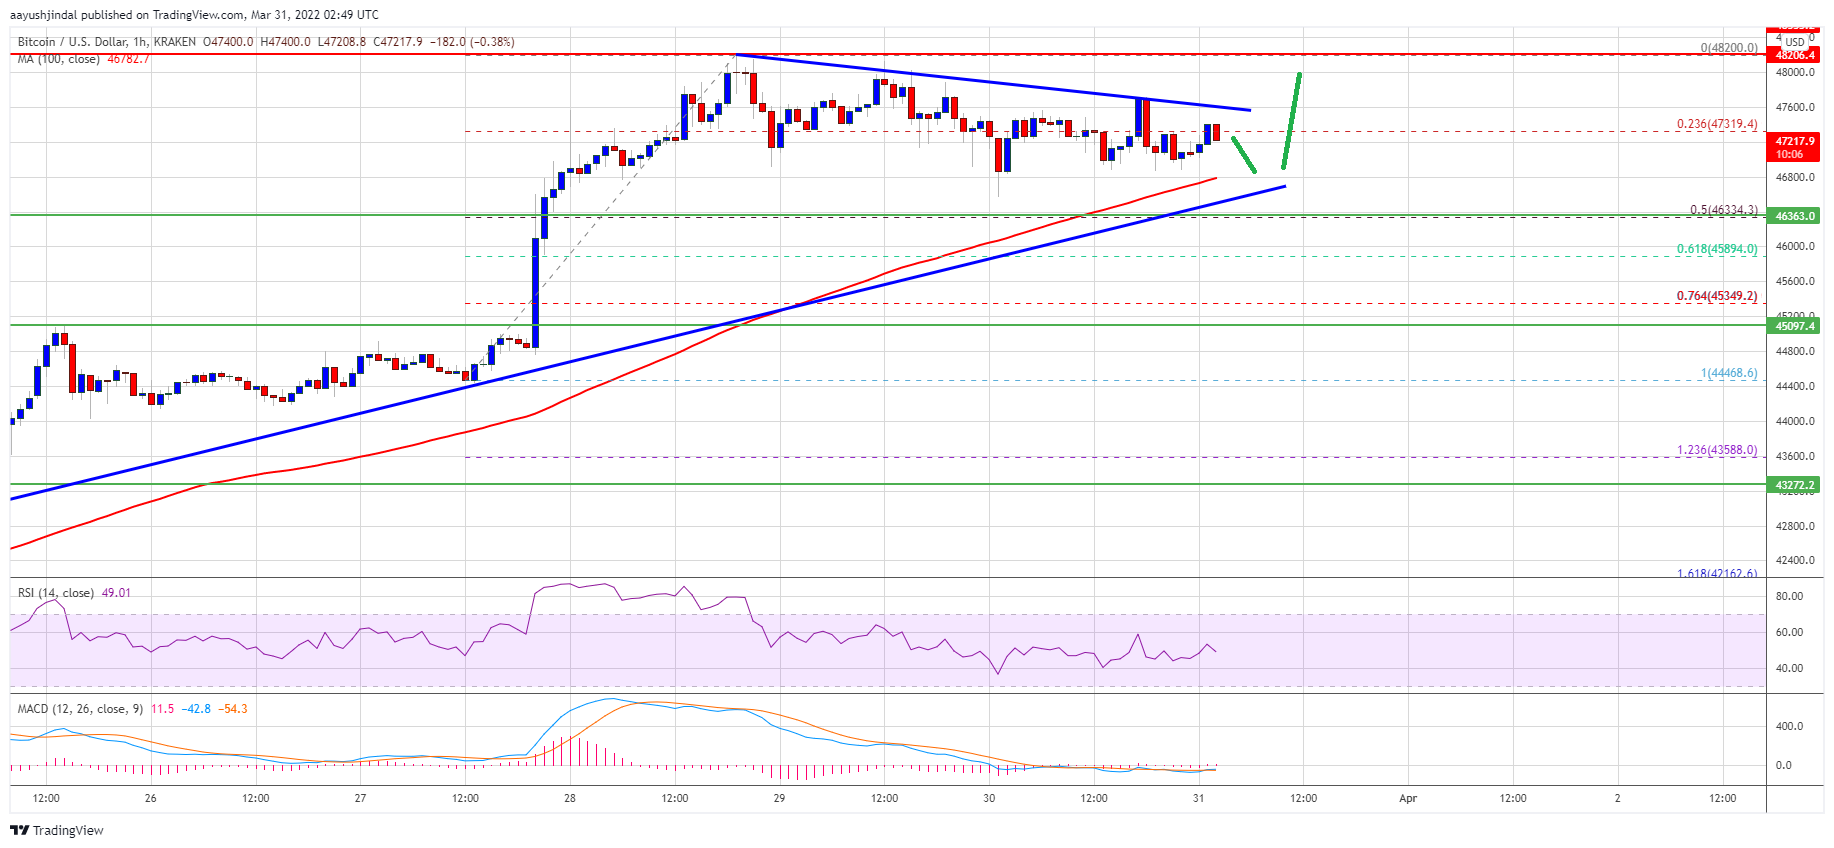
There was a move below the 23.6% Fib retracement level of the upward move from the $44,469 swing low $48,200 high. The price even moved below the $47,000 level, but the bulls were active near the $46,800 and $46,500 levels.
Bitcoin is now trading above $46,500 and the 100 hourly simple moving average. On the upside, the price is facing resistance near the $47,600 level.
There is also a major breakout pattern forming with resistance near $47,700 on the hourly chart of the BTC/USD pair. The next major resistance could be near the $48,000 zone. A successful break and close above the triangle resistance and then $48,000 could start a strong increase.
Source: BTCUSD on TradingView.com
The next major hurdle on the upside might be near the $49,200 level. Any more gains could send the price towards the key the $50,000 level.
Dips Limited in BTC?
If bitcoin fails to clear the $47,700 resistance zone, it could correct further lower. An immediate support on the downside is near the $47,000 zone. The next major support is seen near the $46,800 level and the 100 hourly simple moving average.
The main support now sits near the $46,400 level. It is near the 50% Fib retracement level of the upward move from the $44,469 swing low $48,200 high. A downside break below the $46,400 support zone could send the price to $45,000 in the near term.
Technical indicators:
Hourly MACD – The MACD is slowly gaining pace in the bullish zone.
Hourly RSI (Relative Strength Index) – The RSI for BTC/USD is now just above the 50 level.
Major Support Levels – $46,800, followed by $46,400.
Major Resistance Levels – $47,700, $48,000 and $48,200.
Bitcoin is consolidating below the $48,000 resistance against the US Dollar. BTC could start a fresh rally if it clears the $48,000 resistance zone.
Bitcoin is stable above the $47,000 and $46,800 support levels.
The price is trading above $46,500 and the 100 hourly simple moving average.
There is a major breakout pattern forming with resistance near $47,700 on the hourly chart of the BTC/USD pair (data feed from Kraken).
The pair could start a fresh increase if it manages to clear the $48,000 resistance zone.
Bitcoin price started a minor downside correction after it failed near the $48,200 level. BTC corrected lower and traded below the $47,800 support level.
There was a move below the 23.6% Fib retracement level of the upward move from the $44,469 swing low $48,200 high. The price even moved below the $47,000 level, but the bulls were active near the $46,800 and $46,500 levels.
Bitcoin is now trading above $46,500 and the 100 hourly simple moving average. On the upside, the price is facing resistance near the $47,600 level.
There is also a major breakout pattern forming with resistance near $47,700 on the hourly chart of the BTC/USD pair. The next major resistance could be near the $48,000 zone. A successful break and close above the triangle resistance and then $48,000 could start a strong increase.
Source: BTCUSD on TradingView.com
The next major hurdle on the upside might be near the $49,200 level. Any more gains could send the price towards the key the $50,000 level.
If bitcoin fails to clear the $47,700 resistance zone, it could correct further lower. An immediate support on the downside is near the $47,000 zone. The next major support is seen near the $46,800 level and the 100 hourly simple moving average.
The main support now sits near the $46,400 level. It is near the 50% Fib retracement level of the upward move from the $44,469 swing low $48,200 high. A downside break below the $46,400 support zone could send the price to $45,000 in the near term.
Technical indicators:
Hourly MACD – The MACD is slowly gaining pace in the bullish zone.
Hourly RSI (Relative Strength Index) – The RSI for BTC/USD is now just above the 50 level.
Major Support Levels – $46,800, followed by $46,400.
Major Resistance Levels – $47,700, $48,000 and $48,200.
Tags: bitcoinbtcusdBTCUSDTxbtusd
FeedzyRead More
According to an X post by crypto analyst Ali Martinez, Bitcoin (BTC) is witnessing a…
Following a lackluster performance in recent weeks, Bitcoin appears to be seeing a steady recovery…
Brian Armstrong, the CEO of Coinbase, has recently made an audacious statement regarding Bitcoin that…
The U.S. Marshals Service (USMS) is tasked with managing assets seized by law enforcement in…
Bitcoin has soared past the $98,000 on Thursday, fueling intense debate among traders over whether…
Cryptocurrency prices dropped on Friday, reversing early gains on reports that crypto exchange Bybit was…