TA: Why Bitcoin Price Eyes Crucial Upside Break Above $41.5K
Bitcoin extended its recovery above the $41,400 against the US Dollar. BTC could rally further if there is a clear close above the $41,500 and $41,800.
Bitcoin started a decent recovery wave above the $41,000 and $41,400 levels.
The price is now trading above $41,000 and the 100 hourly simple moving average.
There is a short-term contracting triangle forming with resistance near $41,510 on the hourly chart of the BTC/USD pair (data feed from Kraken).
The pair must clear the $41,500 resistance and $41,800 to start a major upward move.
Bitcoin Price Shows Positive Signs
Bitcoin price formed a base above the $40,000 level. BTC started a decent recovery wave and was able to clear the $41,000 resistance zone.
The price remained in a positive zone and climbed further above the $41,400 level. It even spiked above the $41,500 resistance and settled above the 100 hourly simple moving average. A high was formed near the $41,825 level and the price is now consolidating gains.
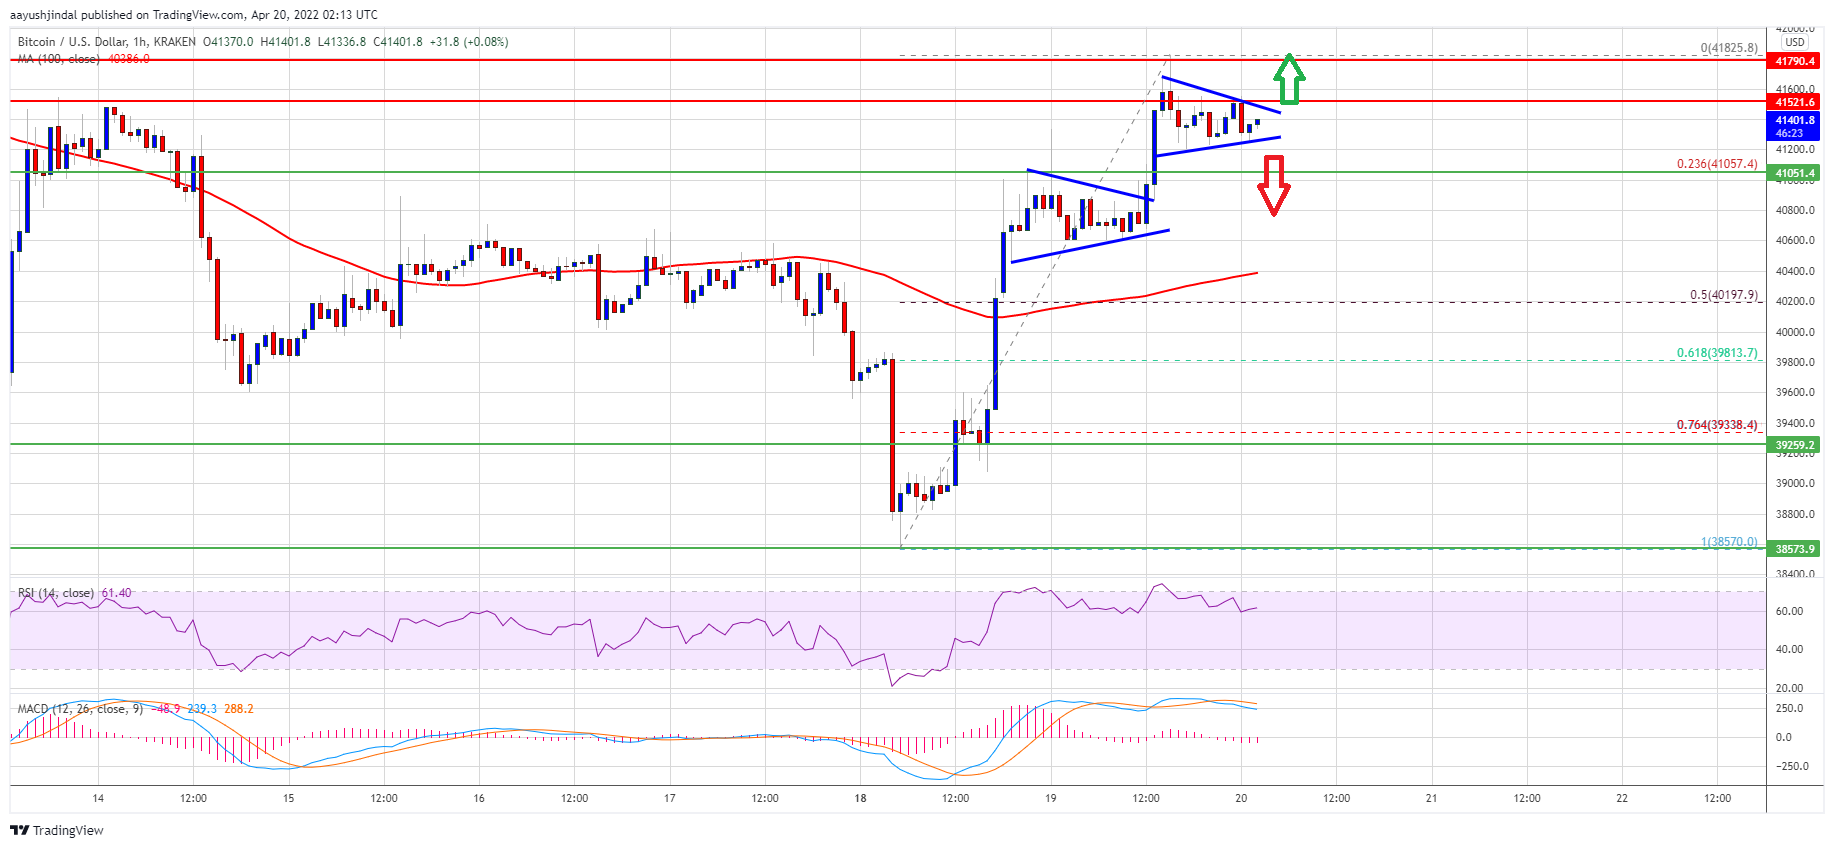
Bitcoin is trading well above the 23.6% Fib retracement level of the recent wave from the $38,570 swing low to $41,825 high. There is also a short-term contracting triangle forming with resistance near $41,510 on the hourly chart of the BTC/USD pair.
Source: BTCUSD on TradingView.com
An immediate resistance on the upside is near the $41,500 level. The next key resistance could be $41,800. To start a strong upward move, the price must settle above the $41,500 zone and then clear $41,800. If the bulls succeed, the price could rise towards the $42,500 resistance zone. Any more gains might call for a move towards the $43,200 level.
Dips Limited in BTC?
If bitcoin fails to clear the $41,500 resistance zone, it could start a downside correction. An immediate support on the downside is near the $41,050 level.
The next major support is seen near the $40,400 level and the 100 hourly simple moving average. It is near the 50% Fib retracement level of the recent wave from the $38,570 swing low to $41,825 high. A downside break below the $40,400 support zone and $40,000 could increase selling pressure.
Technical indicators:
Hourly MACD – The MACD is slowly gaining pace in the bullish zone.
Hourly RSI (Relative Strength Index) – The RSI for BTC/USD is now above the 50 level.
Major Support Levels – $41,050, followed by $40,200.
Major Resistance Levels – $41,510, $41,800 and $42,500.
Bitcoin extended its recovery above the $41,400 against the US Dollar. BTC could rally further if there is a clear close above the $41,500 and $41,800.
Bitcoin started a decent recovery wave above the $41,000 and $41,400 levels.
The price is now trading above $41,000 and the 100 hourly simple moving average.
There is a short-term contracting triangle forming with resistance near $41,510 on the hourly chart of the BTC/USD pair (data feed from Kraken).
The pair must clear the $41,500 resistance and $41,800 to start a major upward move.
Bitcoin Price Shows Positive Signs
Bitcoin price formed a base above the $40,000 level. BTC started a decent recovery wave and was able to clear the $41,000 resistance zone.
The price remained in a positive zone and climbed further above the $41,400 level. It even spiked above the $41,500 resistance and settled above the 100 hourly simple moving average. A high was formed near the $41,825 level and the price is now consolidating gains.
Bitcoin is trading well above the 23.6% Fib retracement level of the recent wave from the $38,570 swing low to $41,825 high. There is also a short-term contracting triangle forming with resistance near $41,510 on the hourly chart of the BTC/USD pair.
Source: BTCUSD on TradingView.com
An immediate resistance on the upside is near the $41,500 level. The next key resistance could be $41,800. To start a strong upward move, the price must settle above the $41,500 zone and then clear $41,800. If the bulls succeed, the price could rise towards the $42,500 resistance zone. Any more gains might call for a move towards the $43,200 level.
Dips Limited in BTC?
If bitcoin fails to clear the $41,500 resistance zone, it could start a downside correction. An immediate support on the downside is near the $41,050 level.
The next major support is seen near the $40,400 level and the 100 hourly simple moving average. It is near the 50% Fib retracement level of the recent wave from the $38,570 swing low to $41,825 high. A downside break below the $40,400 support zone and $40,000 could increase selling pressure.
Technical indicators:
Hourly MACD – The MACD is slowly gaining pace in the bullish zone.
Hourly RSI (Relative Strength Index) – The RSI for BTC/USD is now above the 50 level.
Major Support Levels – $41,050, followed by $40,200.
Major Resistance Levels – $41,510, $41,800 and $42,500.
Tags: bitcoinbtcusdBTCUSDTxbtusd
FeedzyRead More


Recent Posts
Is Bitcoin Price Heading To $137K? Market Expert Says BTC Broke Out Since Nov. 2024
After a somewhat sluggish start to 2025, the Bitcoin price has begun to impress in…
Bitcoin 6-Month Flight Plan To $188,000, Here’s The Roadmap
With Bitcoin back above $100,000, crypto analyst Leo Hart has released a 6-month roadmap on…
Is Bitcoin Headed For A New ATH After $104,000 Triumph? What This Market Expert Thinks
Since reaching a local bottom of $74,000 in mid-April, Bitcoin has seen a market rebound,…
Best Crypto to Buy Now as UFC Legend Conor McGregor Calls for a Bitcoin Strategic Reserve in Ireland
‘Victory to Ireland’ is how Connor McGregor signed off on an emphatic call for a…
Taiwan Official Proposes Bitcoin As Part Of National Reserve Strategy
A Taiwanese politician urged the government Friday to include Bitcoin in its reserve composition. He…
Analysis: Coinbase Is Buying Bitcoin, Just Don’t Call It a Treasury Strategy.
Coinbase (COIN) has its own strategy for BTC on the corporate balance sheet, but it's…