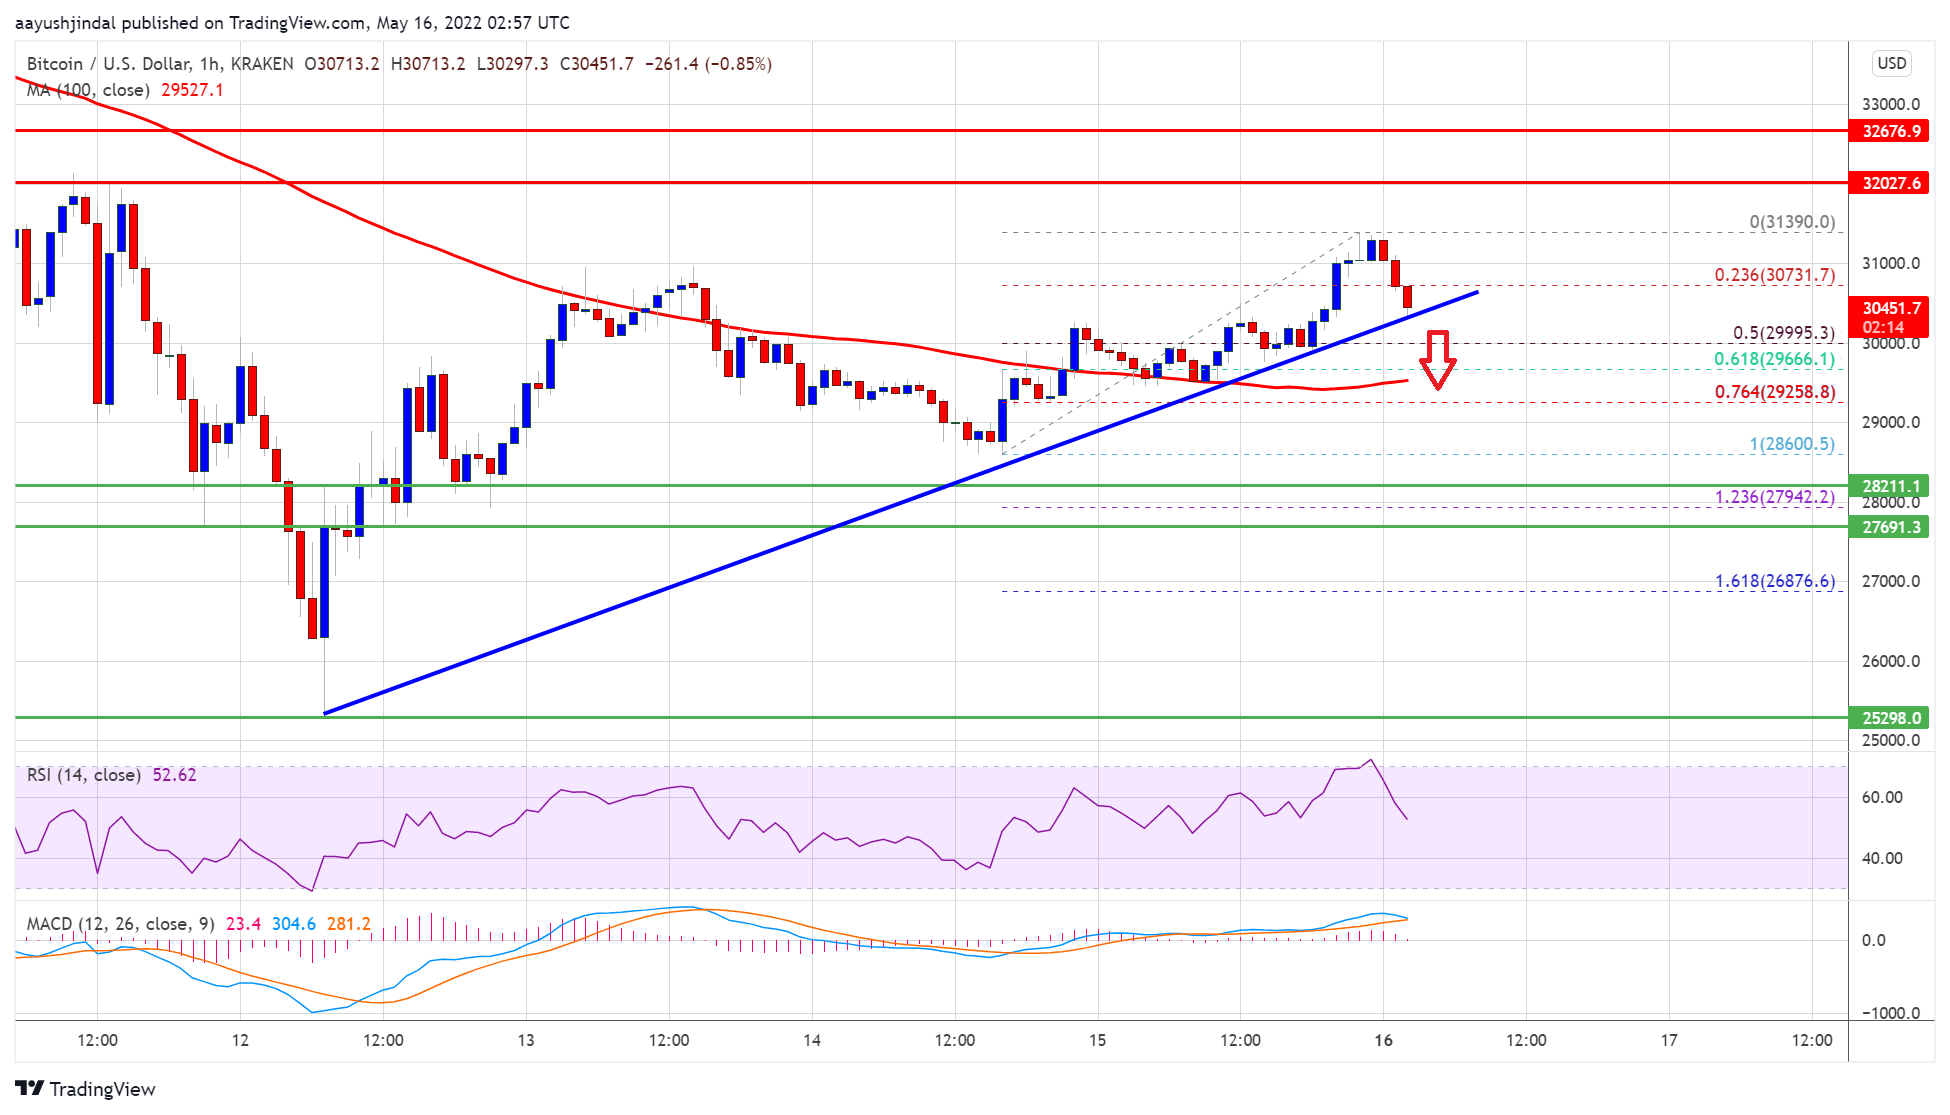
Bitcoin attempted a recovery wave above the $30,000 resistance against the US Dollar. BTC is struggling near $31,000 and might start a fresh decline.
Bitcoin recovered above the $30,000 level but struggled above $31,000.
The price is now well above the $30,000 level and the 100 hourly simple moving average.
There is a key bullish trend line forming with support near $30,400 on the hourly chart of the BTC/USD pair (data feed from Kraken).
The pair could start a fresh decline if it clears the $30,000 support zone
Bitcoin Price Faces Hurdles
Bitcoin price started a decent recovery wave from the $25,000 support zone. BTC gained pace for a move above the $28,000 level and the 100 hourly simple moving average.
It even cleared the $30,000 resistance zone. However, the bulls struggled to stay in action above the $31,000 level. A high is formed near $31,390 and the price is now slowing moving lower. There was a move below the $31,000 level.
Bitcoin moved below the 23.6% Fib retracement level of the upward move from the $28,600 swing low to $31,390 high. The price is now approaching the $30,400 support.
There is also a key bullish trend line forming with support near $30,400 on the hourly chart of the BTC/USD pair. The next major support is near the $30,000 zone. It is near the 50% Fib retracement level of the upward move from the $28,600 swing low to $31,390 high.
Source: BTCUSD on TradingView.com
A downside break and close below the $30,000 support might start a major decline. In the stated case, the price could decline towards the $29,000 level. The next major support is near $28,000 level, below which the price might start a fresh bearish wave.
More Upsides in BTC?
If bitcoin stays above the $30,000 support zone, it could start a fresh increase. An immediate resistance on the upside is near the $31,000 level.
The next major resistance is near the $31,400 level. A clear move above the $31,000 and $31,400 resistance levels might start a fresh increase in the coming sessions. The next key resistance could be near the $32,500 level, above which the price might rise above $33,000.
Technical indicators:
Hourly MACD – The MACD is now gaining pace in the bearish zone.
Hourly RSI (Relative Strength Index) – The RSI for BTC/USD is no near the 50 level.
Major Support Levels – $30,400, followed by $30,000.
Major Resistance Levels – $31,000, $31,400 and $32,500.
Bitcoin attempted a recovery wave above the $30,000 resistance against the US Dollar. BTC is struggling near $31,000 and might start a fresh decline.
Bitcoin recovered above the $30,000 level but struggled above $31,000.
The price is now well above the $30,000 level and the 100 hourly simple moving average.
There is a key bullish trend line forming with support near $30,400 on the hourly chart of the BTC/USD pair (data feed from Kraken).
The pair could start a fresh decline if it clears the $30,000 support zone
Bitcoin price started a decent recovery wave from the $25,000 support zone. BTC gained pace for a move above the $28,000 level and the 100 hourly simple moving average.
It even cleared the $30,000 resistance zone. However, the bulls struggled to stay in action above the $31,000 level. A high is formed near $31,390 and the price is now slowing moving lower. There was a move below the $31,000 level.
Bitcoin moved below the 23.6% Fib retracement level of the upward move from the $28,600 swing low to $31,390 high. The price is now approaching the $30,400 support.
There is also a key bullish trend line forming with support near $30,400 on the hourly chart of the BTC/USD pair. The next major support is near the $30,000 zone. It is near the 50% Fib retracement level of the upward move from the $28,600 swing low to $31,390 high.
Source: BTCUSD on TradingView.com
A downside break and close below the $30,000 support might start a major decline. In the stated case, the price could decline towards the $29,000 level. The next major support is near $28,000 level, below which the price might start a fresh bearish wave.
If bitcoin stays above the $30,000 support zone, it could start a fresh increase. An immediate resistance on the upside is near the $31,000 level.
The next major resistance is near the $31,400 level. A clear move above the $31,000 and $31,400 resistance levels might start a fresh increase in the coming sessions. The next key resistance could be near the $32,500 level, above which the price might rise above $33,000.
Technical indicators:
Hourly MACD – The MACD is now gaining pace in the bearish zone.
Hourly RSI (Relative Strength Index) – The RSI for BTC/USD is no near the 50 level.
Major Support Levels – $30,400, followed by $30,000.
Major Resistance Levels – $31,000, $31,400 and $32,500.
Tags: bitcoinbtcusdBTCUSDTxbtusd
FeedzyRead More
Bitcoin (BTC) continues to move within its one-week range after recovering from its recent drop…
Alexander Vinnik, the jailed former operator of once mighty bitcoin exchange BTC-e, is being released…
Founder: Nicolas Burtey Date Founded: September 2019 Location of Headquarters: United States Number of Employees:…
Bitcoin Twitter (or Bitcoin X) is having a moment after a 13F filing by Goldman…
After a relatively subdued price performance in 2024, Ethereum (ETH) could be on the verge…
In El Salvador, about two hours away from the capital, up in the mountains, lies…