Tron price is rising from the $0.1250 zone against the US Dollar. TRX is outperforming Bitcoin and could rise further above $0.1320.
Tron is moving higher above the $0.1280 resistance level against the US dollar.
The price is trading above $0.130 and the 100-hourly simple moving average.
There is a key bullish trend line forming with support at $0.1305 on the hourly chart of the TRX/USD pair (data source from Kraken).
The pair could continue to climb higher toward $0.1335 or even $0.1350.
Recently, Bitcoin and Ethereum saw a fresh decline below $60,000 and $2,700 respectively. However, Tron price remained stable above the $0.1250 support and climbed higher.
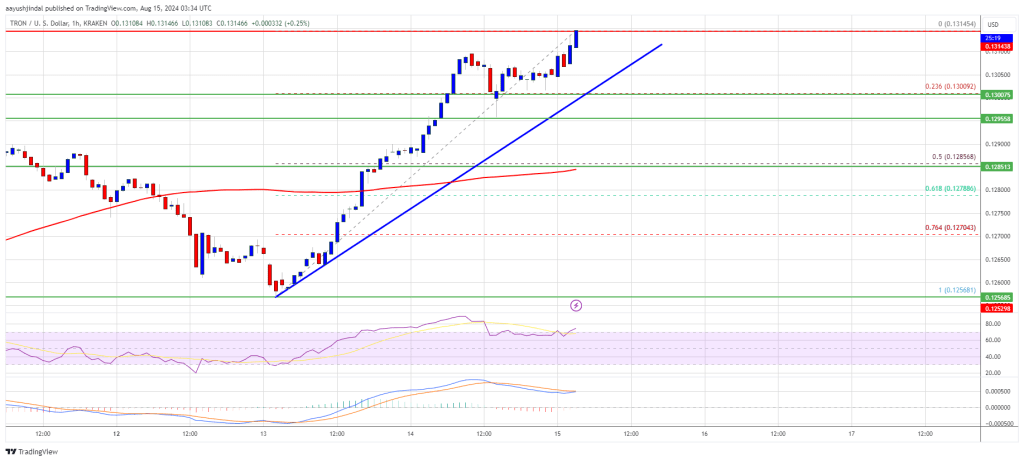
There was a decent move above the $0.1300 resistance zone. TRX price even tested the $0.1315 level. A high is formed at $0.1314 and the price is showing signs of more upsides. There is also a key bullish trend line forming with support at $0.1305 on the hourly chart of the TRX/USD pair.
The trend line is close to the 23.6% Fib retracement level of the upward move from the $0.1256 swing low to the $0.1314 high. The price is now trading above $0.1300 and the 100-hourly simple moving average. On the upside, an initial resistance is near the $0.1320 level
The first major resistance is near $0.1332, above which the price could accelerate higher. The next resistance is near $0.1350. A close above the $0.1350 resistance might send TRX further higher toward $0.1400. The next major resistance is near the $0.1420 level, above which the bulls are likely to aim for a larger increase toward $0.1450 in the near term.
If TRX price fails to clear the $0.1320 resistance, it could start a downside correction. Initial support on the downside is near the $0.1300 zone and the trend line.
The first major support is near the $0.1285 level or the 50% Fib retracement level of the upward move from the $0.1256 swing low to the $0.1314 high, below which it could test $0.1280. Any more losses might send Tron toward the $0.1265 support in the coming sessions.
Technical Indicators
Hourly MACD – The MACD for TRX/USD is gaining momentum in the bullish zone.
Hourly RSI (Relative Strength Index) – The RSI for TRX/USD is currently above the 50 level.
Major Support Levels – $0.1300 and $0.1285.
Major Resistance Levels – $0.1320 and $0.1350.
[#item_full_content]NewsBTCRead MoreIn a recent client note, Standard Chartered’s Head of Digital Assets Research, Geoff Kendrick, predicted…
Ethereum experienced one of the most chaotic trading days in its history last Monday, as…
Bitcoin price started another decline below the $100,500 zone. BTC is trimming gains and might…
Strategy (MSTR) reported a fourth-quarter net loss of $3.03 per share, compared to income of…
The world's largest asset management firm with more than $10 trillion in AUM, Blackrock (BLK)…
In an escalation of global economic friction, President Trump’s imposed tariffs have roiled financial markets…