Tron price is holding gains above $0.0825 against the US Dollar. TRX is outperforming Bitcoin and could rise further toward $0.095.
Tron is moving higher above the $0.0825 resistance level against the US dollar.
The price is trading above $0.0830 and the 100 simple moving average (4 hours).
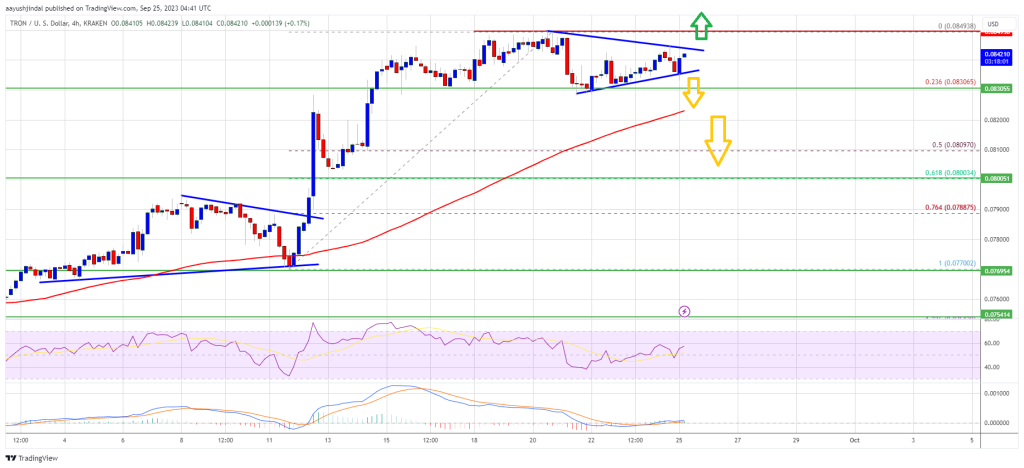
There is a short-term contracting triangle forming with resistance near $0.0844 on the 4-hour chart of the TRX/USD pair (data source from Kraken).
The pair could continue to climb higher toward $0.088 or even $0.095.
In the last Tron price prediction, we discussed how TRX outperformed Bitcoin against the US Dollar. TRX remained stable and was able to settle above the $0.080 pivot level.
There was a decent increase above the $0.0825 and $0.0832 resistance levels. A high was formed near $0.0849 and the price recently corrected lower. There was a minor decline below the $0.0835 level. However, the bulls were active near the $0.0830 support.
The price found support near the 23.6% Fib retracement level of the upward move from the $0.0770 swing low to the $0.0849 high. TRX is now trading above $0.0825 and the 100 simple moving average (4 hours). There is also a short-term contracting triangle forming with resistance near $0.0844 on the 4-hour chart of the TRX/USD pair.
On the upside, an initial resistance is near the $0.0844 level. The first major resistance is near $0.0850, above which the price could accelerate higher. The next resistance is near $0.088.
Source: TRXUSD on TradingView.com
A close above the $0.088 resistance might send TRX further higher toward $0.0920. The next major resistance is near the $0.095 level, above which the bulls are likely to aim for a larger increase toward $0.095.
If TRX price fails to clear the $0.085 resistance, it could slowly move lower. Initial support on the downside is near the $0.083 zone. The first major support is near the $0.082 level or the 100 simple moving average (4 hours).
The next major support is near $0.080 or the 61.8% Fib retracement level of the upward move from the $0.0770 swing low to the $0.0849 high, below which the price could accelerate lower. The next major support is $0.0770.
Technical Indicators
4 hours MACD – The MACD for TRX/USD is gaining momentum in the bullish zone.
4 hours RSI (Relative Strength Index) – The RSI for TRX/USD is currently above the 50 level.
Major Support Levels – $0.083, $0.082, and $0.080.
Major Resistance Levels – $0.085, $0.088, and $0.095.
[#item_full_content]NewsBTCRead MoreBitcoin price failed to gain pace for a move above the $100,000 zone. BTC again…
Bitcoin’s price rally may be under threat as it continues to trade under $100,000. According…
A new technical analysis on TradingView suggests Bitcoin may be approaching a decisive moment, with…
The Bitcoin market continued to struggle in February marked by a high level of investor…
Bitcoin has experienced a tiring price action in recent weeks, with the price struggling to…
A former cryptocurrency exchange executive remarked that Bitcoin is an inescapable reality, a statement that…