XRP Maintains Support: Can It Rise Amid BTC and ETH Declines?
XRP price extended gains above the $0.6220 zone. The price tested the $0.6330 zone before there was a pullback amid declines in BTC and ETH.
XRP price started a downside correction from the $0.6330 zone.
The price is now trading near $0.600 and the 100-hourly Simple Moving Average.
There is a connecting bullish trend line forming with support at $0.5920 on the hourly chart of the XRP/USD pair (data source from Kraken).
The pair could start another increase if it stays above the $0.590 support zone.
XRP Price Holds Uptrend Support
XRP price extended its increase above the $0.6150 resistance. It even climbed above the $0.6220 resistance before the bears appeared. A high was formed at $0.6330 before Bitcoin and Ethereum dragged the market lower.
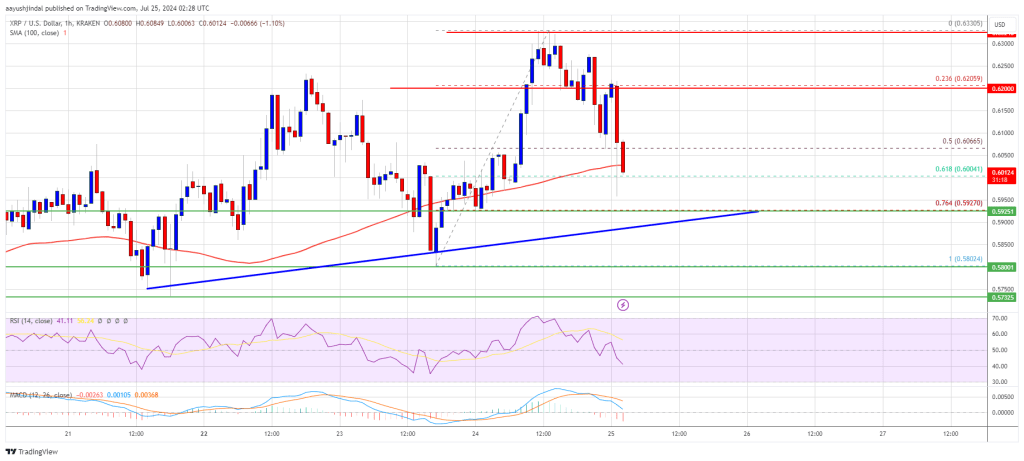
There was a move below the $0.6150 and $0.6120 levels. The price declined below the 50% Fib retracement level of the upward move from the $0.5802 swing low to the $0.6330 high. It is now trading near $0.600 and the 100-hourly Simple Moving Average.
There is also a connecting bullish trend line forming with support at $0.5920 on the hourly chart of the XRP/USD pair. The trend line is close to the 76.4% Fib retracement level of the upward move from the $0.5802 swing low to the $0.6330 high.
If there is a fresh upward move, the price could face resistance near the $0.6120 level. The first major resistance is near the $0.6200 level. The next key resistance could be $0.6220. A clear move above the $0.6220 resistance might send the price toward the $0.6350 resistance. The next major resistance is near the $0.6500 level. Any more gains might send the price toward the $0.680 resistance.
More Losses?
If XRP fails to clear the $0.6120 resistance zone, it could continue to move down. Initial support on the downside is near the $0.5950 level. The next major support is at $0.5920 and the trend line zone.
If there is a downside break and a close below the $0.5920 level, the price might continue to decline toward the $0.580 support in the near term.
Technical Indicators
Hourly MACD – The MACD for XRP/USD is now gaining pace in the bearish zone.
Hourly RSI (Relative Strength Index) – The RSI for XRP/USD is now below the 50 level.
Major Support Levels – $0.5920 and $0.5800.
Major Resistance Levels – $0.6120 and $0.6220.
[#item_full_content]NewsBTCRead More


Recent Posts
Bitcoin ETFs Hit $40 Billion Inflows, Setting Historic Crypto Record
Based on figures that Bloomberg analyst James Seyffart has shared, spot Bitcoin ETFs have already…
Is Bitcoin Price Heading To $137K? Market Expert Says BTC Broke Out Since Nov. 2024
After a somewhat sluggish start to 2025, the Bitcoin price has begun to impress in…
Bitcoin 6-Month Flight Plan To $188,000, Here’s The Roadmap
With Bitcoin back above $100,000, crypto analyst Leo Hart has released a 6-month roadmap on…
Is Bitcoin Headed For A New ATH After $104,000 Triumph? What This Market Expert Thinks
Since reaching a local bottom of $74,000 in mid-April, Bitcoin has seen a market rebound,…
Best Crypto to Buy Now as UFC Legend Conor McGregor Calls for a Bitcoin Strategic Reserve in Ireland
‘Victory to Ireland’ is how Connor McGregor signed off on an emphatic call for a…
Taiwan Official Proposes Bitcoin As Part Of National Reserve Strategy
A Taiwanese politician urged the government Friday to include Bitcoin in its reserve composition. He…