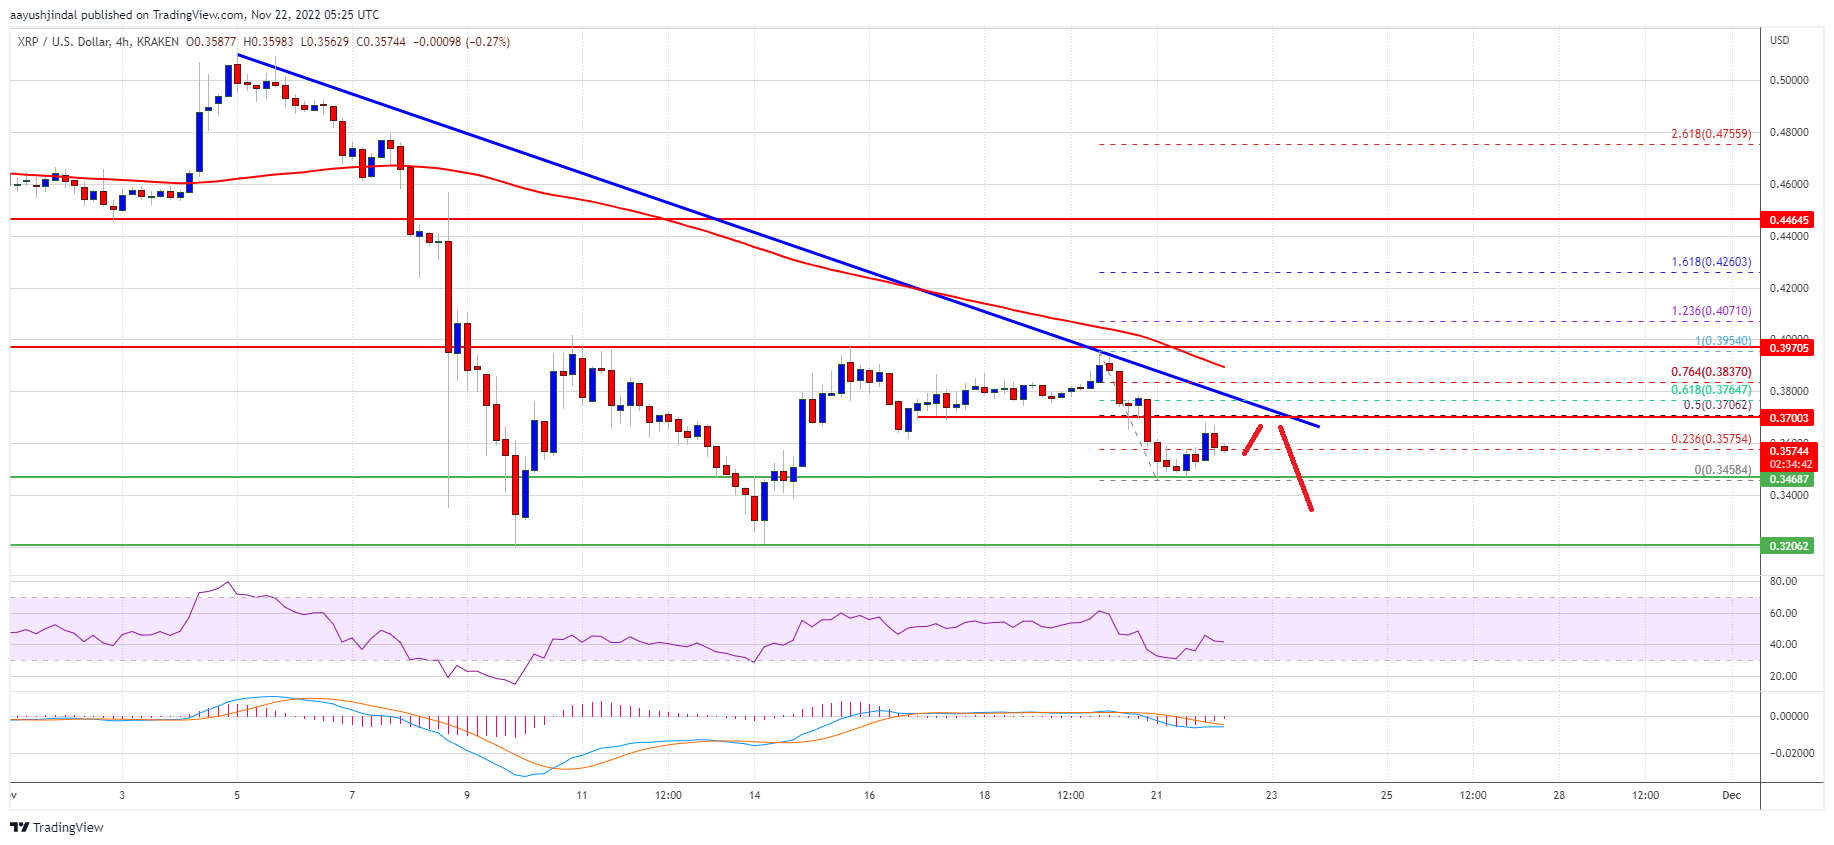
Ripple failed to clear $0.40 and corrected lower against the US Dollar. XRP price could start a decent increase if it stays above the $0.345 support zone.
Ripple started a fresh decline from the $0.40 resistance zone against the US dollar.
The price is now trading below $0.380 and the 100 simple moving average (4-hours).
There is a key bearish trend line forming with resistance near $0.371 on the 4-hours chart of the XRP/USD pair (data source from Kraken).
The pair could start a strong increase if it clears the $0.388 resistance zone.
This past week, ripple’s XRP attempted an upside break above the $0.40 resistance against the US Dollar. However, the bears remained active near $0.40 and pushed the price lower.
However, the recent decline was limited when compared to bitcoin and ethereum. The price declined below the $0.372 and $0.365 support levels. It traded as low as $0.3458 and is currently consolidating losses. It is trading below $0.380 and the 100 simple moving average (4-hours).
XRP price is now facing hurdles near $0.370. It is close to the 50% Fib retracement level of the downward move from the $0.3954 swing high to $0.3458 swing low.
There is also a key bearish trend line forming with resistance near $0.371 on the 4-hours chart of the XRP/USD pair. A successful break above the trend line resistance might send the price towards the $0.380 resistance or the 76.4% Fib retracement level of the downward move from the $0.3954 swing high to $0.3458 swing low.
Source: XRPUSD on TradingView.com
The next key resistance is near the $0.388 level. The main barrier is still near the $0.40 level. Any more gains might send the price towards the $0.45 level.
If ripple fails to clear the $0.388 resistance zone, it could slowly move down. An initial support on the downside is near the $0.345 level.
The next major support is near $0.332. If there is a downside break and close below the $0.332 level, xrp price could extend losses. In the stated case, the price could even decline below the $0.320 support.
Technical Indicators
4-Hours MACD – The MACD for XRP/USD is now losing pace in the bearish zone.
4-Hours RSI (Relative Strength Index) – The RSI for XRP/USD is now below the 50 level.
Major Support Levels – $0.345, $0.332 and $0.320.
Major Resistance Levels – $0.371, $0.388 and $0.400.
Tags: RipplexrpXRPBTCXRPUSDxrpusdcxrpusdt
NewsBTCRead More
Bitcoin has been stuck for the last three months, trading between $90K and $100K. It…
Litecoin has been gaining momentum in recent weeks, and according to crypto analyst Tony “The…
Bitcoin (BTC) miners listed in the U.S. are growing their share of the network hashrate,…
Metaplanet (3350) said it bought a further 269.43 bitcoin (BTC), strengthening its position as a…
The U.S. crypto task force will focus on starting up a national bitcoin (BTC) reserve,…
Bitcoin (BTC) has been relatively listless this month, hunching below $100,000. However, this hasn't deterred…